Tuesday, August 10, 2021

A Sneak Peek into VT Alerts

 360-degrees insights into your assets

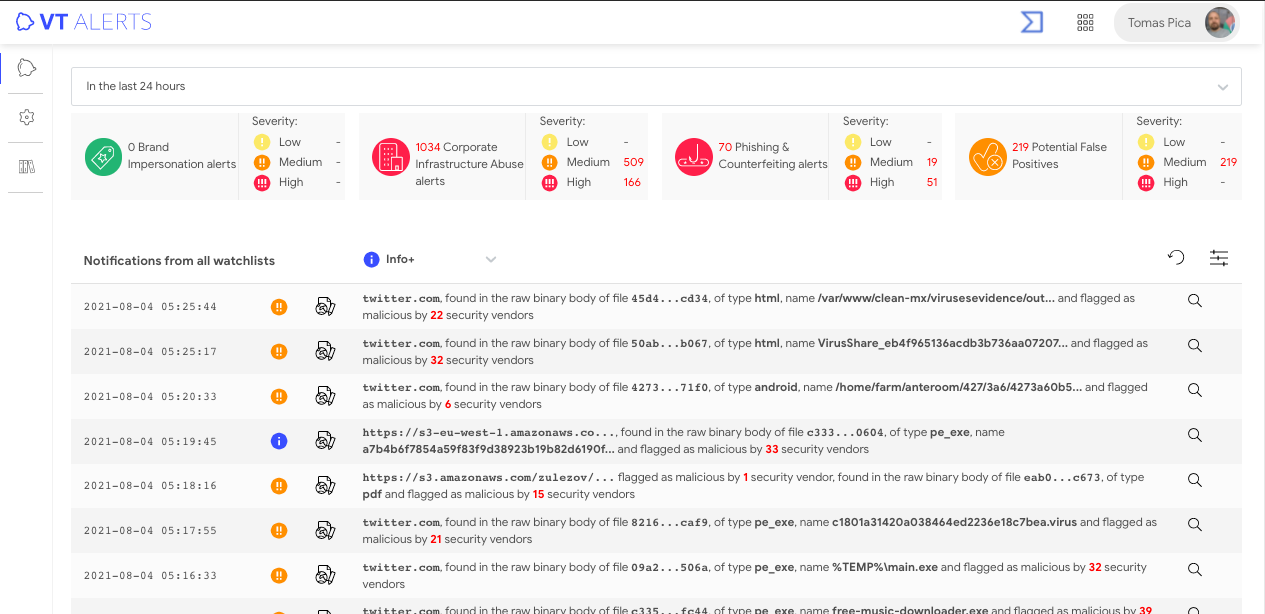
One of the most sought-after use cases in VirusTotal is to find information about how our assets might be being abused. Is there any attacker using our brand for some spear phishing? Are there any malware samples using our infrastructure for malware distribution? Traditionally, many of our users monitored the use of their assets (such as domains, IPs and intellectual property) using YARA Livehunts © or VTI searches. Good news everyone! To help our users make this use case more straightforward, automated, and automatable (and also to have the results in a colourful and nice interface), we are introducing VT Alerts.

VT Alerts is designed to provide a feed-like experience providing different severity notifications on anything we detected in VirusTotal that matches your infrastructure and intellectual property. 

At launch, VTAlerts will be ready to help our customer monitor Corporate Infrastructure, Phishing attacks, and Brand Impersonation.

And that’s everything we have to say, for now. VTAlerts will be officially launched September 2021, and of course you will have all details here. In the meantime, if you are interested in joining our Beta program, please let us know. 

Happy hunting!


Monday, August 02, 2021

Introducing ‘Known Distributors’

 Providing more context about file provenance and distribution

These days many security operations center (SOC) teams are overwhelmed by huge volumes of alerts. Triaging these alerts takes too long, and many are never investigated at all. "Alert fatigue" leads analysts to take alerts less seriously than they should, resulting in missed threats and consummated breaches. 


One of VirusTotal’s main use cases is automatic security telemetry enrichment with the aim of performing alert triage. Indeed, VirusTotal is not only one of the largest and richest malware datasets in the world, over the years we have aggregated all sorts of security-relevant data points for files, URLs, domains and IPs, including goodware indicators and provenance details. As a result, many SOCs are using VirusTotal to perform automated false positive discarding, eradicating alert fatigue and making sure that their teams stay focused on relevant alerts enriched with superior context.


To make this use case more straightforward, today we are introducing Known Distributors, a new attribute for file objects that determines which companies/products a given file belongs to. Before having Known Distributors, we had multiple attributes in the file object to determine its origin, including:

  • nslr_info

  • trusted_verdicts

  • monitor_info

  • “software-collection” tag


Each one of these attributes was ingested from a different data source and had a different data format. For VirusTotal users it was difficult to spot the difference between the three since all had the same purpose. Now everything is unified under the same attribute, making its analysis and ingestion easier. 


Please note that the old attributes listed above will be deprecated as of January 1st, 2022. 


When to make use of this?


As said, many SOCs use VirusTotal for automatic false positive discarding. Here is when the Known Distributors property comes in handy. 


Let’s say you find the following hash 6d17958c6527346036f35c6d9db2f5c8d820cbfbd043588304c7beddf7ea8641 among a list of IoCs collected from a hypothetical incident. 


Querying VirusTotal’s API provides the following information about the sample:


$ curl --request GET \
  --url "https://www.virustotal.com/api/v3/files/6d17958c6527346036f35c6d9db2f5c8d820cbfbd043588304c7beddf7ea8641?attributes=known_distributors" \
  --header 'x-apikey:  <your API key>'
{
    "data": {
        "attributes": {
            "known_distributors": {
                "filenames": [
                    "MoUsoCoreWorker.exe"
                ],
                "products": [
                    "windows-cloud-windows-server-2004-dc-core-v20210608"
                ],
                "distributors": [
                    "Microsoft"
                ],
                "data_sources": [
                    "HashDB"
                ]
            }
        },
        "type": "file",
        "id": "6d17958c6527346036f35c6d9db2f5c8d820cbfbd043588304c7beddf7ea8641",
        "links": {
            "self": "https://www.virustotal.com/api/v3/files/6d17958c6527346036f35c6d9db2f5c8d820cbfbd043588304c7beddf7ea8641"
        }
    }
}     


Note: To get more information about these fields check out our API documentation


The information provided in the resulting JSON makes it easy to understand that Microsoft claims the file as part of Windows Server 2004. At VirusTotal’s web interface, the same information is presented to the user as follows:



In case of a file being distributed by multiple companies, it is shown as in the image below:


Where does all this data come from?


Known distributors data is ingested from the following data sources:


  • HashDB - An internal service that extracts files from base OS images and OS updates. 

  • National Software Reference Library (NSRL) - A project supported by the U.S. Department of Homeland Security, federal, state, and local law enforcement, and the National Institute of Standards and Technology (NIST) which is designed to collect software from various sources and incorporate file profiles computed from this software into a Reference Data Set (RDS) of information.

  • VT Monitor - A VirusTotal service that periodically scans files coming from software publishers to mitigate false positives.

  • Trusted Source project - A set of partnerships with key software vendors to appropriately tag files that they distribute, including those that are not signed.


We are also actively working on some partnerships with renowned software download portals so as to consolidate author and distribution metadata for software that they list. 


Why is this more relevant than ever?


ING’s global CISO recently pointed out that: “AI/ML can potentially solve issues with scalability in human analysis. Though it is working now [...], we do see challenges with AI/ML models that trigger on wrong assumptions. This results in many false positives in the security detection process, which need to be investigated by humans.


Indeed, at VirusTotal we have also seen how the inclusion of AI/ML in detection engines has led to more false positives, and, most importantly to increasing lack of context. Many detections these days do not include any malware family/toolkit label and since they are ML-powered, the analyst is provided with no additional information beyond a red flag, which in some cases might be misleading. By incorporating the Known Distributors details along with VirusTotal’s wealth of contextual information, security teams can overcome the shortcomings of noisy detection mechanisms that have yet to mature. 


We hope that these changes will ease the alert triage use case. Please let us know if you have any questions or suggestions to keep making VirusTotal better for everyone.


Happy hunting!


Wednesday, July 07, 2021

Having the right tool for the job

Not all the investigations are tackled the same way. Sometimes from a single sample we need to quickly find as much context as possible. In other situations, we are presented with a handful of IOCs and we need to make a sense of what’s going on. 

When you have a few pieces of the puzzle, the most natural is to put all of them on the table (by the way, this table will also find some extra missing pieces for you). And here it is when VirusTotal Graph can make your life easier. Never heard of it? No worries, this video will show you how to use it!


VirusTotal Graph will allow you to make Visual Investigations, an extremely useful resource to save valuable time by allowing efficient evaluation of incidents. If you want to know more about this topic, join us for our workshop next July 15th at 15:00 UTC along our friends from Maltego and Kaspersky.

But stay with us! In this blog post we want to provide you some cool examples of what kind of magic you can do with VT Graph.


Context in less than 1 minute


We have a few IOCs from some APK malware samples we suspect are connected, and we are interested in finding out if they have any common infrastructure. This would allow us to quickly react by, for instance, blocking any related domain or IP in our network. In this case, we will use Anatsa samples as an example.

First, we create a new graph using the IOCs from the previous link, in this case: 

  • 49de707fc2d7e44e14f8d50ea7d731fd8abda3418acd106c78cee833183e240f
  • aa435c4da9fa1bb3bb186a0bce1fd9710c227b8d72fa82d71a426df82c236eb1
  • 7bc0f932d40f17abc43f8b25a9d75408b192f55c742a02843c5e31869d3d4684


At this point, the new graph will automatically calculate all the relationships for us. This can be a bit noisy if we are only interested in the infrastructure, so we can remove all the other relationships leaving only “contacted URLs” and “contacted IPs”. This results in the following graph


The whole process took less than one minute and shows us that the IP 185.215.113[.]31 is used by all three initial samples. Not only that, from the URLs paths we already have some ideas what kind of actions this malware is doing.

What else to do here? For instance, you can fully expand the node with the suspicious IP 185.215.113[.]31 to find all the samples downloaded from it (quite a lot) in order to continue your investigation. If we would be interested in keeping the full relationships automatically created in this graph instead of a simplified version for the infrastructure, we could also find similar files to the ones we are analyzing. Another interesting finding is a common file between the analyzed samples found in the PCAP files resulting from their execution in sandboxes: this file contains the malicious injects sent from the C&C server to the bots. 


This is a lot of information from just dropping some IOCs into a graph! Most of the time this will be more than enough for having a first idea of what we are dealing with.


Map the entire infrastructure behind a domain


Sometimes a simple domain investigation can turn into a complex scenario. Given the nature of the dataset in which VirusTotal Graph works, it is easy to find all the subdomains, URLs and resolutions that VirusTotal knows about a domain.


Let’s take a look at the suspicious “ladycash[.]ru” domain. We can simply do a series of relationships expansions to reach a point where we uncover different sub-domains and all the different IP addresses all over the world they resolve. And voilà! After a few clicks we have valuable data to continue our investigation of a potentially malicious infrastructure.


Link to graph by ushadrons


The power of the community


Probably the most amazing thing about VirusTotal Graph is our community ❤️

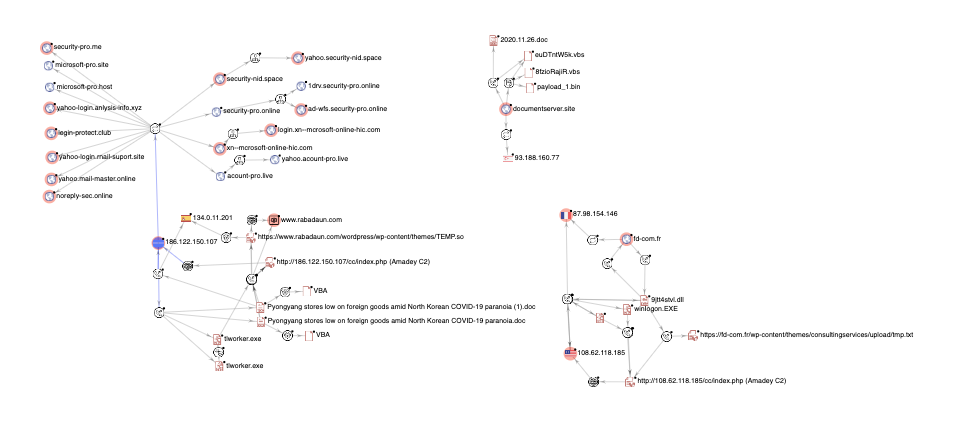
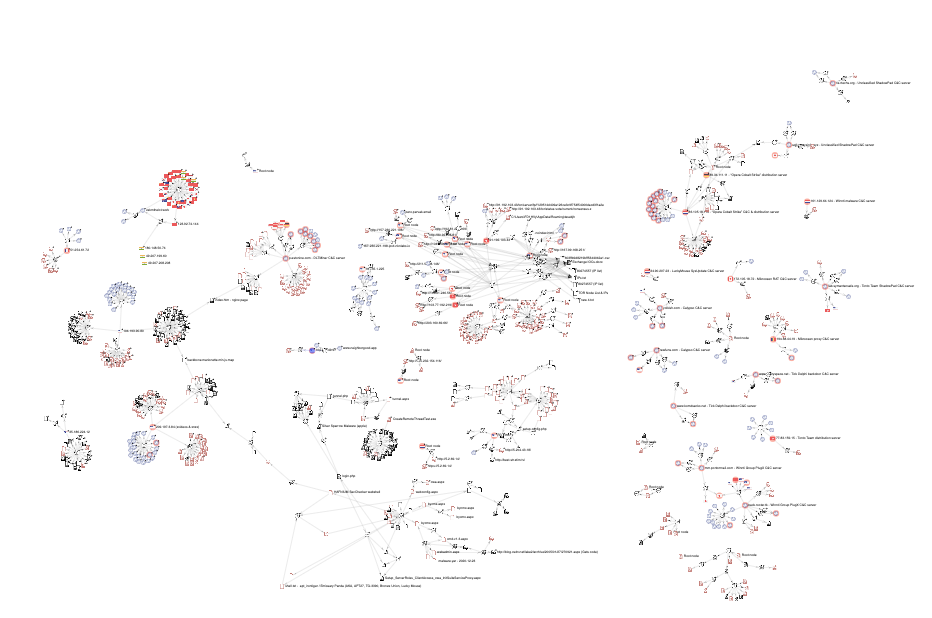
It is daily used by many security researchers who are happy to share their work and help with their findings making a safer world. Their public graphs are available in the VirusTotal Graph search. Below you can find some graphs that showcase some of their amazing research.


Improving our toolset


Many times we find how attackers are improving their toolsets. Well, we as security practitioners should do the same! VirusTotal Graph is another tool in our pocket that can be very useful to do a quick assessment of malicious activity. Having a visual representation of all the relationships from a collection of IOCs helps to have a quick understanding of some basic properties of the set, like how the malware is clustered, what types of files we have, how many similar files are found, what is the infrastructure being used and (if we get lucky) how it is being distributed. 


We are working hard to get an even improved and even more efficient version of VirusTotal Graph, so we will as always appreciate all your input and feedback on how we can help you with your visual investigations.


Happy hunting!


Thursday, May 13, 2021

, , , , , , , , ,

Compliant, easy and actionable integration of VirusTotal in 3rd-party products - Welcome VT Augment

TL;DR: We are releasing an official, compliant and recommended method for displaying VirusTotal context in 3rd-party products and services, so that end-users can enjoy a single pane of glass experience when working with their tools of choice. Read the docs / See the demo (click on the VirusTotal icon next to each observable).


Security analysts world-wide are demanding a single pane of glass experience from their products. Corporate cybersecurity stacks are increasingly complex: too many tools and services, information scattered across numerous databases, arduous stitching together of disparate sources, etc. Incident response and threat hunting have become a time consuming quest across multiple browser tabs. The experience is poor.

If you develop some kind of security product, you will probably know that a common request coming from users is to integrate VirusTotal threat context and reputation. CrowdStrike can speak to this popular demand, just recently we worked together to build a Falcon-VirusTotal integration for their CrowdStrike store. We will be speaking about this and other integrations with our antivirus partners in future posts.

Notwithstanding, at VirusTotal we have to make sure that our data is not misused to the detriment of the ecosystem, this is why we have a strict policy regarding scanning companies and use of our services. This is also why our premium service terms prohibit displaying raw data in 3rd-party products and interfaces, especially those exposed to end-customers.

This said, over time we have seen many legit use cases for integration, mostly revolving around enrichment (adding a layer of context) of alerts/detections that get generated through some means other than VirusTotal. Indeed, when Incident Responders and SOC analysts review alerts, they want to answer questions such as:
  • Given a hash in an alert, is there any second stage payload that I should be searching for in my environment?
  • What’s the C2 infrastructure tied to a given hash? Has it shown up in my network logs?
  • Given a domain flagged by my IDS, is it a flagrant false positive based on its popularity and malicious observations recorded by VirusTotal?
  • Given an IP address that matched my threat feeds, has it been seen serving malware? If so, which hashes? Have those been seen across my fleet of machines?
  • Once my EDR reveals a compromise, is it a well known threat to the industry? i.e. is it widely detected? Is it rather a targeted attack?
To answer these and other questions many companies have implemented a bring-your-own-api-key model where their end-users plug their VirusTotal API key into their products. Sightings recorded in those products then get automatically enriched via such key. While this is theoretically OK, it has resulted in poor and weak integrations that:
  • Are extremely basic and often just display detection ratios, which is not only on the verge of compliance but is pretty useless given today’s false positive and false negative rates.
  • Fail to display the wealth of contextual information that VirusTotal records: C2s and network traffic, delivery mechanisms, relationships with other artifacts, submission and in-the-wild metadata, crowdsourced detections via {YARA, SIGMA, IDS} rules, etc.
  • Do not evolve as VirusTotal itself improves. Whenever we incorporate new data points or release new features, these rarely show up in those integrations. Moreover, for them to show up the integrator must invest engineering resources to update the logic.
  • Miss the opportunity to create a single product experience where common customers can easily pivot from the 3rd-party product into VirusTotal to conduct deeper investigations.
Not everything is lost. We are introducing VT AUGMENT, an HTML widget that greatly reduces the heavy lifting required to display VirusTotal context in 3rd-party products:
  • It can enrich the most common threat observables: files/hashes, domains, IPs and URLs.
  • You do not need to parse complex API response objects and build fancy templates, VirusTotal directly serves a report with all the context that we have for the observable.
  • The report can be styled to match your interface.
  • VirusTotal seamlessly adds new features and data points to the widget, without requiring engineering work on your side to update.
  • It allows you to display all VirusTotal details, not just a subset of them. Moreover, it is not constrained to an analysis data dump, it also displays our threat graph for the given observable and any related IoCs.

All the details displayed in the report are pivotable, meaning that your users can search for similar files, jump to other files communicating with the same domain, discover other malware signed with the same authenticode certificate, etc. with a single click.


Most importantly, VT AUGMENT technically ensures compliance with our terms. Since we are not exposing parseable API fields, there is no room for backend black magic to drive detections, perform machine learning, copy signatures or other non-compliant use cases that would go against the VirusTotal ecosystem.

You can see VT AUGMENT in action in the following demo environment that simulates a SIEM alerts dashboard, click on the VirusTotal icon next to each observable to display the VT AUGMENT widget:
https://www.virustotal.com/ui/widget/demo/dedicated?full=1

Please note that VT AUGMENT still requires you to implement a bring-your-own-api-key model where your end-users plug their API key into your product. This said, we are also open to consider integrations driven by a single integrator key, always with prior consent from VirusTotal.


You can dive into the specifics surrounding the VT AUGMENT integration in our API reference:
https://developers.virustotal.com/v3.0/reference#widget-overview

A standard VirusTotal API key will be enough to test the flow, but remember that the final setup must make use of each of your users’ API keys, unless you have explicit permission from VirusTotal. Additionally, note that we have also published a handy javascript client library to further ease the task of displaying the widget report in your own interface:
https://github.com/VirusTotal/vt-augment

If you are interested in integrating VT AUGMENT and require more API quota to develop and test the setup, need some help with the technical implementation or want to discuss partnership opportunities involving this new widget please do not hesitate to contact us.

We will be creating a specific section in our main VirusTotal website to document and showcase these integrations. Similarly, we will be showing some gratitude to the first adopters by featuring their integrations in an upcoming blog post series on this topic, stay tuned!

Monday, May 10, 2021

Context is king (part I) - Crowdsourced Sigma rules

In our previous blog post we started discussing how important it is to have relevant context when doing any investigation and how at VirusTotal, we are working hard to provide as much context as possible. Indeed, there are many new features we have already implemented and that we want to share with all of you. Today we will discuss Crowdsourced Sigma rules.


What are Sigma rules? Probably at this point you are already familiar with YARA: in essence, a rule-based engine to detect certain patterns in files. YARA became a de-facto standard in Threat Intelligence sharing, widely used for static detection, attribution, monitoring and hunting.


With this same idea in mind, Sigma was developed as a “YARA for logs”, allowing the creation of generic rules that could be later used in most SIEMs. Given Sigma rules match against System event logs, one of the main differences with YARA is that rules will be behaviour-based instead of matching static patterns in files.


Now, at VirusTotal our sandboxes store all event logs during detonation, which are later used to match Crowdosourced Sigma rules. In particular, we are importing rules from the following public repositories (big thanks to all of them for their help):


If you are curious, you can even check the full list of rules and the number of matches for each of them in our documentation.

Relevant additional context for file reports

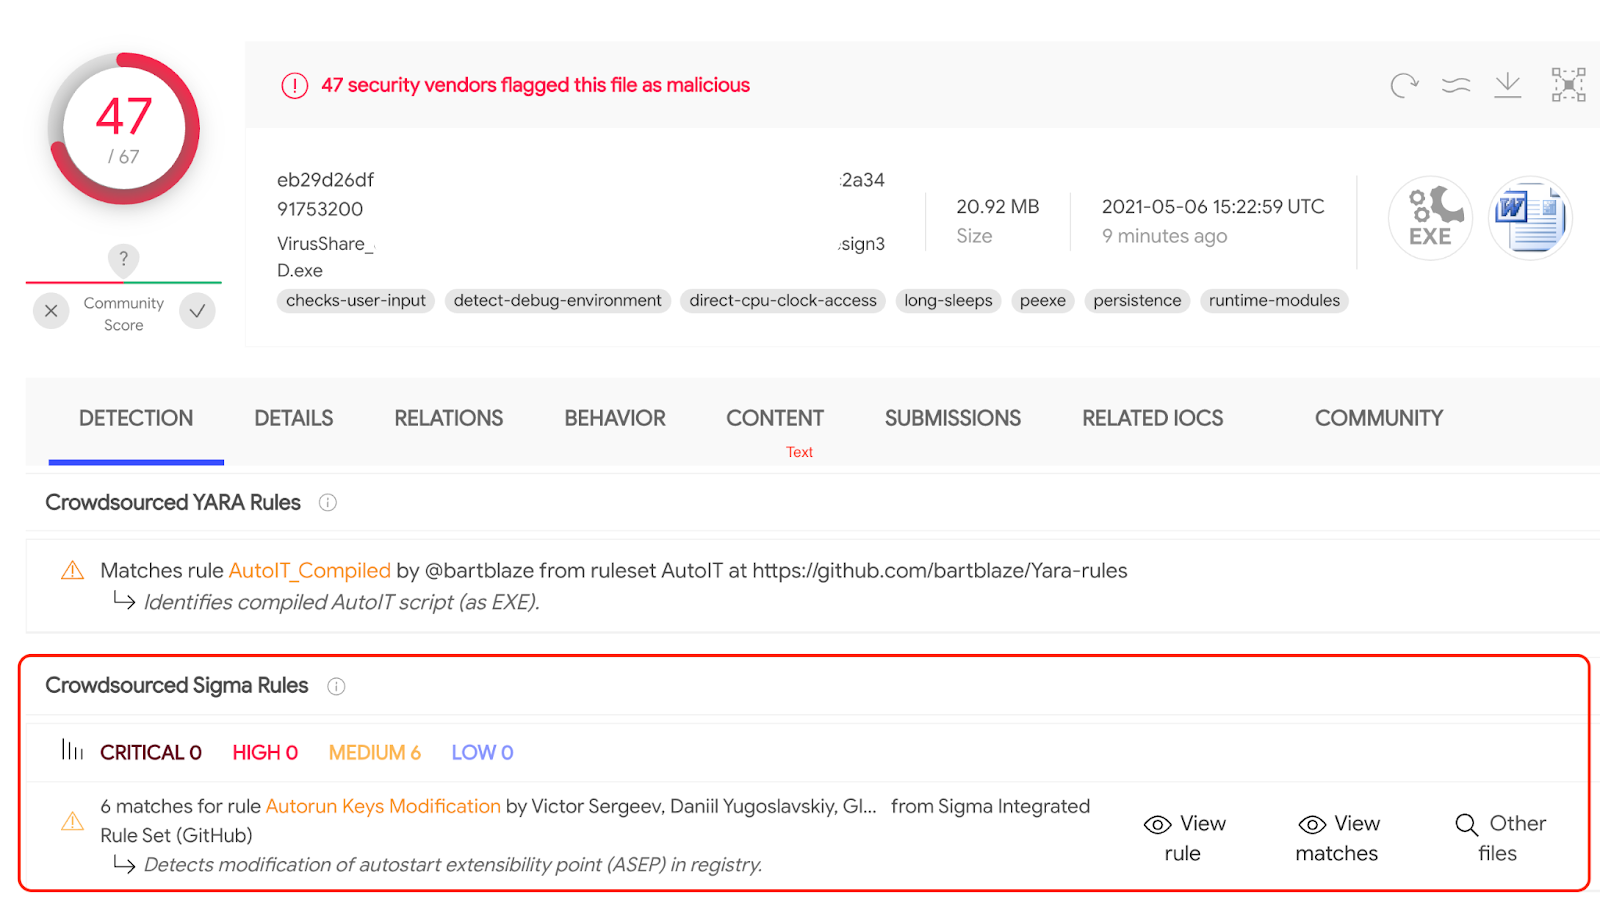
Sigma matches help researchers and investigators get more context about a given file. It is also an additional and quick way of finding potentially related files based on the same behaviour. Similar to Crowdsourced YARA rules, VirusTotal Intelligence users will find the list of Sigma rules matching a given file in the Detection tab:


From there you can View the rule itself, check what events made this file to match this rule in particular, as well as finding other files matching this Sigma rule. Remember that for finding all the files matching a given Sigma rule you can always use the “sigma_rule” modifier followed by its ID as shown in the Sigma rules list documentation (or by simply clicking on them).


For example, the following search returns all matches for the “Milum malware detection” Sigma rule (based on WildPressure APT)”:

        sigma_rule:30fcf3924a898a9d1747e89068ab2990c77ca3914a94aa78466d28a9d9da32bb

When opening some of the search results in a Graph, we can see there are relationships among them:

Keep in mind that you can add more search modifiers to your Sigma rule search. For instance, we can add to our previous rule a filter to get the results that also matched any Crowdsourced YARA rule, probably this will help us to quickly identify the subset of results we are interested in as well as serve as a double check:  

        sigma_rule:30fcf3924a898a9d1747e89068ab2990c77ca3914a94aa78466d28a9d9da32bb have:crowdsourced_yara_rule

From here we can further pivot and select just the subset that additionally matches a particular set of YARA rules. All this context helps us to save time and adds a very relevant source of information when determining a file’s maliciousness.


Context for detection

Sigma matches can be used as a nice addition to AV detections. For instance, we can quickly find undetected files having Sigma matches:

        have:sigma_rule p:0

It is also possible to filter by rule severity by using the sigma_<severity> search operator. To search undetected files having no detections and matching high severity rules we can do:

        p:0 sigma_high:1+

Since the sigma_<severity> operator accepts integer values, it is possible to set a minimum severity for the matching rules. The aforementioned previous search query will find files matching Sigma rules with at least severity 1 or higher.


For instance, as a result of searching “p:0 sigma_high:5+”, the following file is returned:

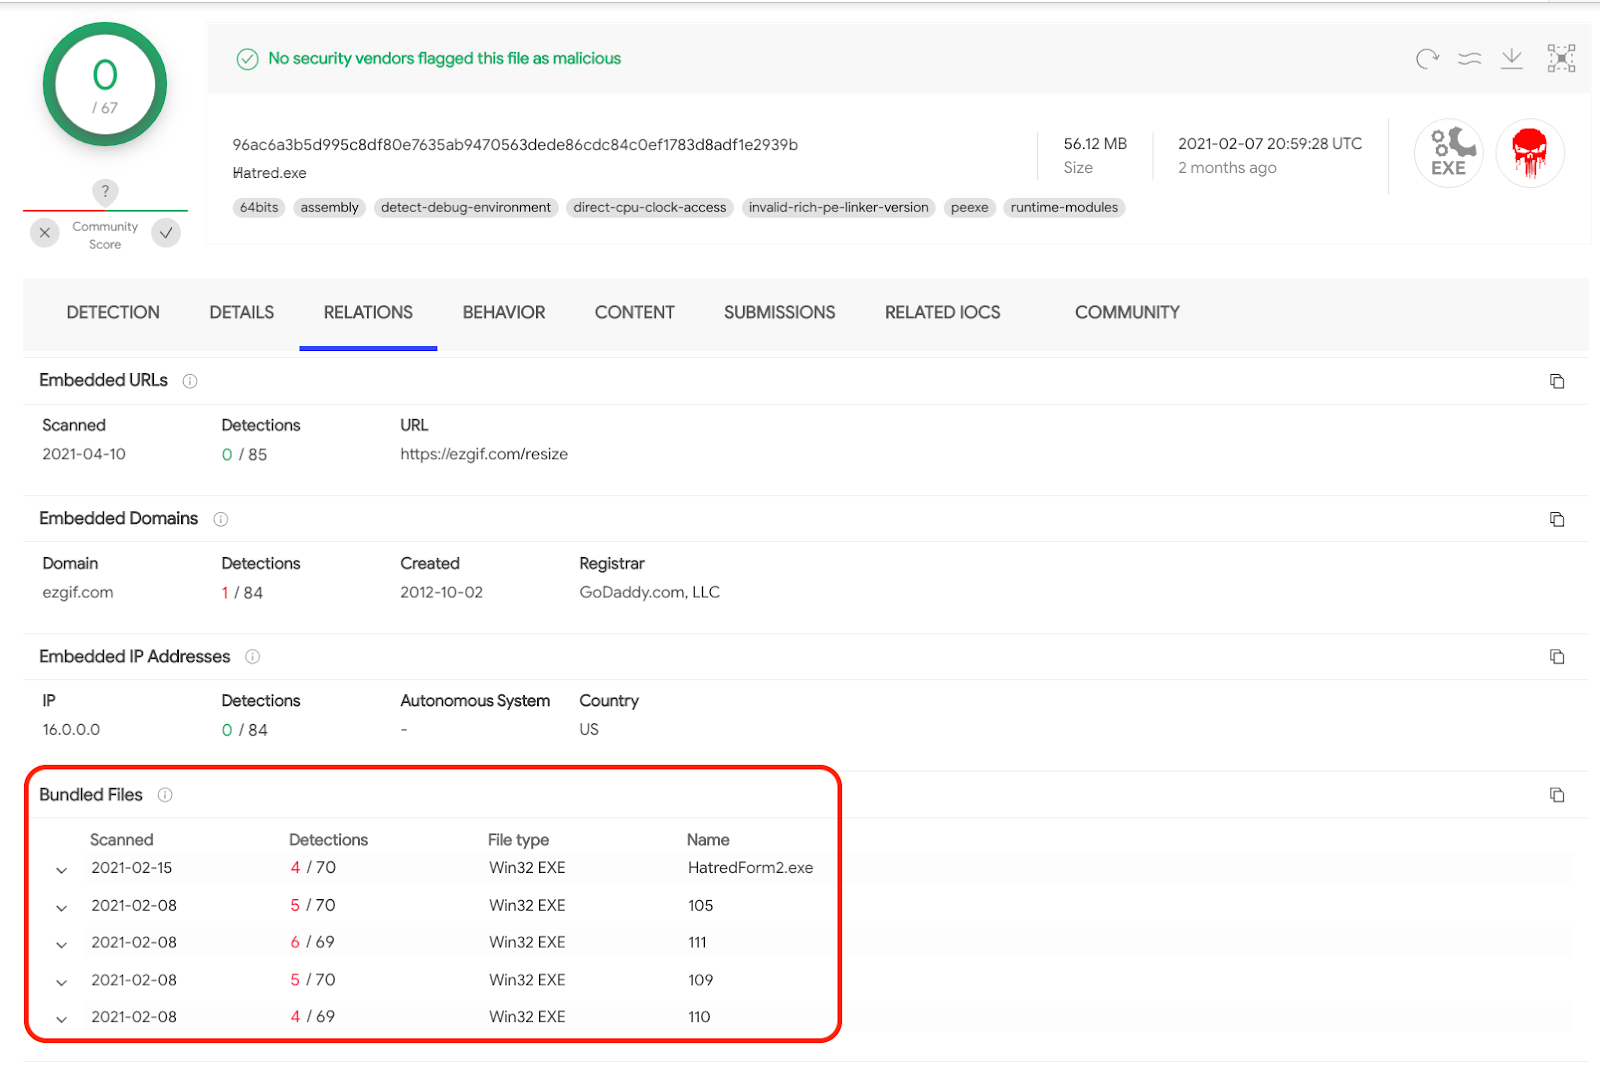
Even though it has no AV detections, its bundled files have:


Fooled by context?


A final thought about adding more context.


We believe the more relevant information we have around any set of activities or IOC, the better. However, sometimes different pieces of information can contradict each other: what to do then? It really depends, the previous example is a good one in this direction as it shows how some malware was not detected given some technicality (was packing other malware inside) but when run in the sandbox the Sigma rule fired up. 


We do a great effort in trying to keep all the crowdsourced elements we add as relevant as possible, carefully selecting the sources. But there might always be clashes, especially when it comes to aspects such as attribution where different security companies might have different mappings for APT groups.


Still, we find all these additions of great value for Threat Intelligence practitioners. As we all know, Intelligence is not bought but produced: we keep working hard to provide you with all the relevant signals you can use to make your own informed decisions.


Thursday, March 25, 2021

Leveraging adversarial data for security control validation

 Nowadays defenders have at their disposal a big amount of data describing how attackers proceed in their malicious campaigns, including TTPs (Techniques, Tactics and Procedures) and artefacts used. Threat Intelligence is the discipline that, in simple words, tries to make sense of all of this - then it is up to us how to make this knowledge actionable. The decision on how to use it in the most effective way depends on every organization, but there are different well-established methods gaining traction in the industry that will provide you with immediate valuable feedback about your defenses. Let’s explore them in more detail.

One way of leveraging this adversarial data is using it to check that our defenses are up to date to protect us against current real threats and campaigns. But before we go on, if you want to know more about this topic join us in our webinar with AttackIQ next March 31st 15:00 UTC.


In this blogpost we will discuss a few scenarios and examples where this data can be used for adversary-driven red-teaming. 


Checking the last sound campaign


The idea behind this is pretty simple. Every time details about a new relevant campaign are made public (how to define relevance depends on every organization) we can simply take a look at different artefacts available and see how they are being detected by our defenses. Let’s take as an example Sunburst malware discovered last December. We can start by finding some indicators to start with.


We could start by checking a couple of hashes in VTGraph to check if there are any graphs already shared by the community. Sometimes graphs are a more up-to-date and more enriched source of information than the original release of IOCs, typically more static. In this particular case we can find a few interesting graphs; we simply select one of them


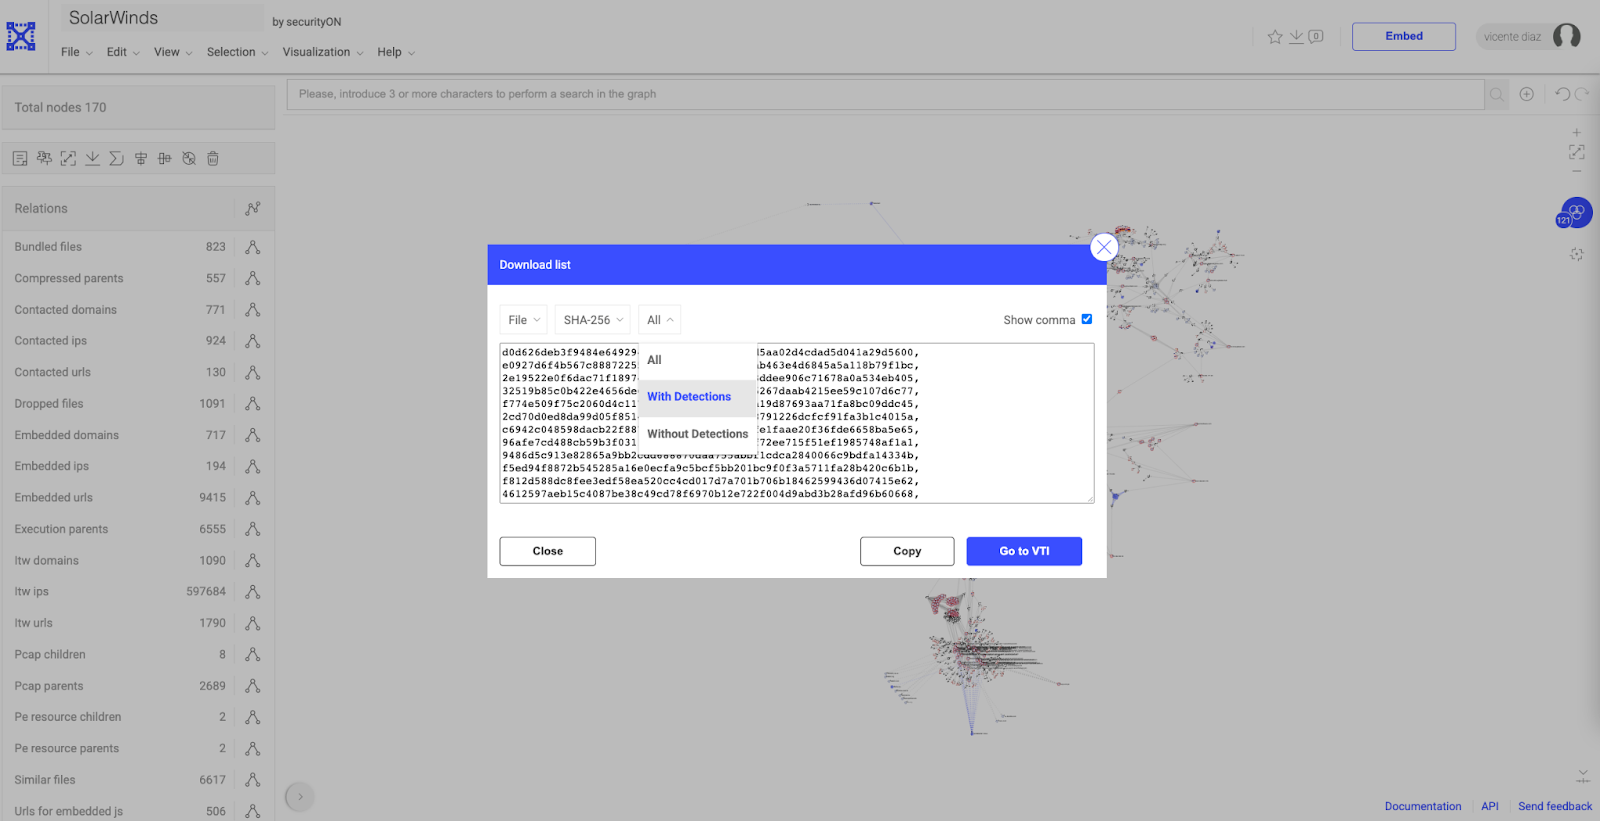
Now, what to select from this investigation? It depends on what we want to check, but we could start by taking a look at all the documents or executables used in the attack. Here we should export the IOCs (you can go to Selection>Select All>Files, then export this data). At this point we can choose, for instance, Hashes with Detection and then open in VTI:


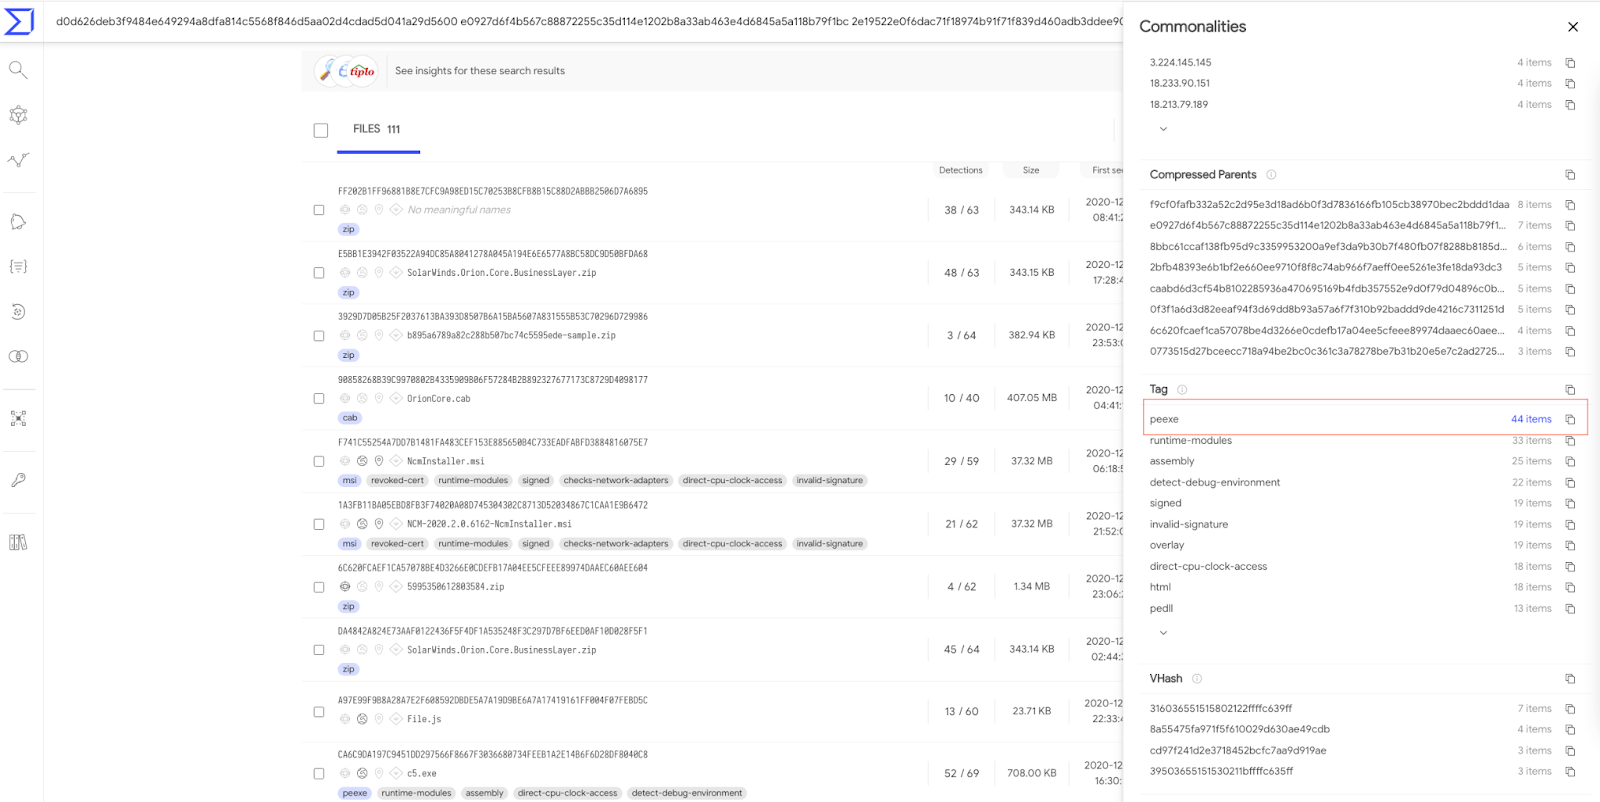
In this view it is simple to filter by file type. By clicking on the Commonalities button, we will find all the different types in the samples resulting from the query, which we can copy or directly open in VTI, but this selection of samples are ready to be used in our red-teaming exercise.   


Minimizing our infection surface against ransomware


In this scenario our first step would be understanding how fresh ransomware campaigns are being spread. We can do this in different ways, a simplistic approach would be checking by verdicts including “ransom” for recently seen malware:


Good news is that we can use many different angles for finding suspicious files, including crowdsourced YARA rules. For instance, from the previous query we could enforce finding results already spotted by some crowdsourced YARA rule, this way we can identify what rules are interesting for further pivoting:

engines:*ryuk* fs:2021-01-01+ type:peexe have:crowdsourced_yara_rule

Once we find any interesting rule, we can use it to find additional artefacts, like in this example where we use one of the crowdsourced YARA rules to find new Ryuk samples


Keeping an eye on fresh suspicious attachments


This is a use case I strongly recommend implementing to any organization. Given spear-phishing continues to be the most used infection vector, why not regularly monitor anything new coming this way? There are many different ways to do that, a generic approach could be something like this query to find fresh docx files suspected of being malicious and having macros.


We can be a bit more specific by adding additional search modifiers, for instance, which ones of the previous files we have seen being distributed as attachments in spear-phishing attempts:

tag:attachment type:docx fs:2021-03-01+ p:5+ s:2+ tag:macros

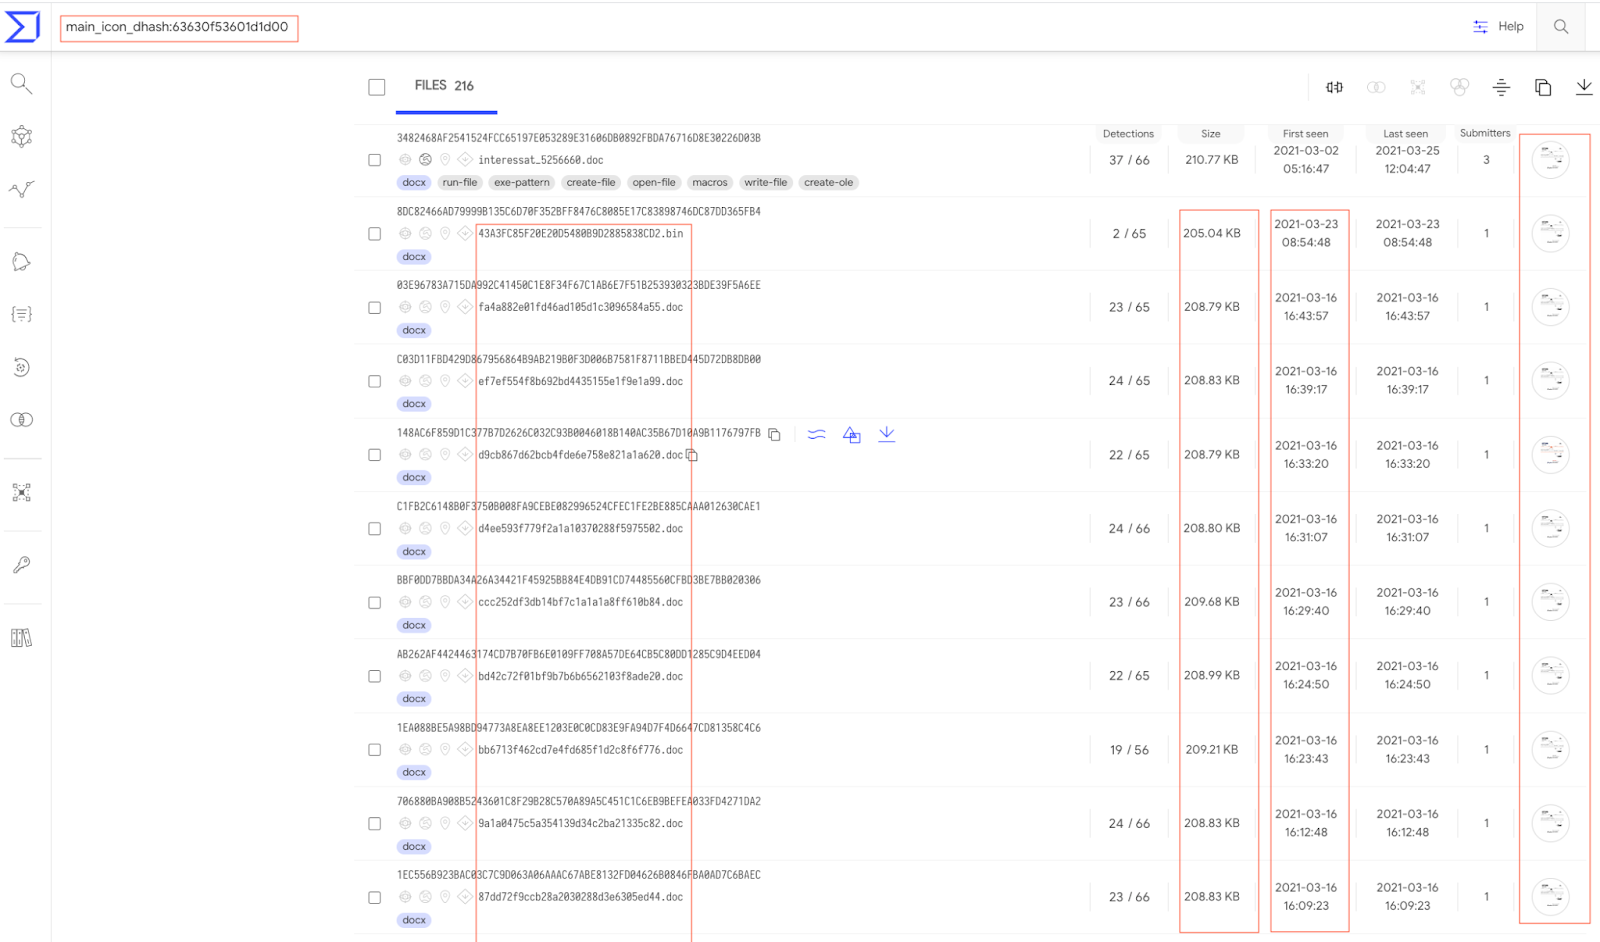
Once we have this information in front of us it is relatively easy to spot some patterns. For instance, the visual aspect of this file seems pretty common in the list of suspected samples, we can simply use visual similarity to find more artefacts.


The resulting set of samples not only have the same visual aspect, they also share a pattern for the file name, they have similar file size and were created around the same time. Armed with this information, we want to make sure we detect this new campaign before it spreads further. 


A must for our security strategy


Including adversarial data in our security strategy provides us with real world validation for our defenses. We can use this on a regular basis and shape it to our needs and weaknesses. Continuing monitoring particular adversaries, malware families and campaigns will help us understand how attackers evolve and how to shape our defenses. Not only that, crowdsourced intelligence allows us to stay one step ahead of adversaries by learning from other attacks and making sure our defenses are up to date before being hit by attackers.


We presented here just a few ideas we encourage everyone to explore with an open mind. For instance, in addition to the previous examples we could also use PCAP files generated by malware for replaying traffic in your infrastructure and check how effective your networking monitoring and detection capabilities are.  


Make sure to join us in our webinar to get additional pro tips!


Happy hunting