Showing posts with label API. Show all posts

Tuesday, September 30, 2025

, , ,

Advanced Threat Hunting: Automating Large-Scale Operations with LLMs

Last week, we were fortunate enough to attend the fantastic LABScon conference, organized by the SentinelOne Labs team. While there, we presented a workshop titled 'Advanced Threat Hunting: Automating Large-Scale Operations with LLMs.' The main goal of this workshop was to show attendees how they could automate their research using the VirusTotal API and Gemini. Specifically, we demonstrated how to integrate the power of Google Colab to quickly and efficiently generate Jupyter notebooks using natural language.

It goes without saying that the use of LLMs is a must for every analyst today. For this reason, we also want to make life easier for everyone who uses the VirusTotal API for research.

The Power of the VirusTotal API and vt-py

The VirusTotal API is the programmatic gateway to our massive repository of threat intelligence data. While the VirusTotal GUI is great for agile querying, the API unlocks the ability to conduct large-scale, automated investigations and access raw data with more pivoting opportunities.

To make interacting with the API even easier, we recommend using the vt-py library. It simplifies much of the complexity of HTTP requests, JSON parsing, and rate limit management, making it the go-to choice for Python users.

From Natural Language to Actionable Intelligence with Gemini

To bridge the gap between human questions and API queries, we can leverage the integrated Gemini in Google Colab. We have created a "meta Colab" notebook that is pre-populated with working real code snippets for interacting with the VirusTotal API to retrieve different information such as campaigns, threat actors, malware, samples, URLs among others (which we will share soon). This provides Gemini with the necessary context to understand your natural language requests and generate accurate Python code to query the VirusTotal API. Gemini doesn't call the API directly; it creates the code snippet for you to execute.

For Gemini to generate accurate and relevant code, it needs context. Our meta Colab notebook is filled with examples that act as a guide. For complex questions, it will be nice to provide the exact field names that you want to work with. This context generally falls into two categories:

  1. Reference Documentation: We include detailed documentation directly in the Colab. For example, we provide a comprehensive list of all available file search modifiers for the VirusTotal Intelligence search endpoint. This gives Gemini the "vocabulary" it needs to construct precise queries.
  2. Working Code Examples: The notebook is pre-populated with dozens of working vt-py code snippets for common tasks like retrieving file information, performing an intelligence search, or getting relationships. This gives Gemini the "grammar" and correct patterns for interacting with our API.

Example of code snippet context that we have included in our meta colab:

query_results_with_behaviors = []
query = "have:sigma have:yara have:ids have:malware_config fs:1d+ have:bundled_file tag:overlay"
RELATIONS = "behaviours"

async for itemobj in cli.iterator('/intelligence/search',params={'query': query, 'relationships': RELATIONS, 'relationship_attributes[%s]'%(RELATIONS): '\*'},limit=0):
    query_results_with_behaviors.append(itemobj.to_dict())

res_with_behaviors = list(query_results_with_behaviors)
Diagram showing the flow from User's Action to Actionable Intelligence via Gemini and VirusTotal API

Practical Example: Hunting for Malicious LNK Files

One of the exercises in our workshop focused on analyzing malicious LNK files submitted to VirusTotal in a specific period of time to limit results. The goal was to discover common execution techniques and interesting command-line patterns.

Here’s how you could approach this with natural language queries in our meta Colab:

1. Retrieve all LNK file objects matching the criteria.

You can start by asking Gemini:

Create a code snippet to retrieve all LNK files submitted from January 1st, 2025, until April 1st, 2025, with 5 or more positives.

Code generated:

query_results = []

# Query for LNK files submitted between January 1st, 2025, and April 1st, 2025, with 5 or more positives.
query = "fs:2025-01-01+ fs:2025-04-01- p:5+ type:lnk"

async for itemobj in cli.iterator('/intelligence/search',params={'query': "%s"%(query)},limit=0):
    query_results.append(itemobj.to_dict())

lnk_files = list(query_results)
print(f"Found {len(lnk_files)} LNK files matching the criteria.")

2. Flatten the data and visualize it.

Next, you can ask Gemini to process the retrieved data and create visualizations:

Flatten the data in a dataframe and create a bar chart depicting the most common TargetFileDOSName values.

Code generated:

import pandas as pd
import plotly.express as px

# Extract the 'attributes' dictionary from each object in our results
attributes_list = [result.get('attributes', {}) for result in lnk_files]

# Use json_normalize to create a flat DataFrame
df_flat = pd.json_normalize(attributes_list)

# Check if 'exiftool.TargetFileDOSName' column exists and is not empty
if 'exiftool.TargetFileDOSName' in df_flat.columns and not df_flat['exiftool.TargetFileDOSName'].empty:
    # Count the occurrences of each TargetFileDOSName
    target_file_counts = df_flat['exiftool.TargetFileDOSName'].value_counts().reset_index()
    target_file_counts.columns = ['TargetFileDOSName', 'Count']

    # Get the top 10 most common TargetFileDOSName values for visualization
    top_target_files = target_file_counts.head(10)

    # Create an interactive bar chart
    fig = px.bar(top_target_files,
                 x='Count',
                 y='TargetFileDOSName',
                 orientation='h',
                 title='Top 10 Most Common TargetFileDOSName in LNK files',
                 labels={'Count': 'Number of Occurrences', 'TargetFileDOSName': 'Target File DOS Name'})
    fig.show()
else:
    print("The 'exiftool.TargetFileDOSName' column was not found or is empty in the flattened data.")

print("DataFrame shape:", df_flat.shape)
df_flat.head()

This will generate a code snippet using pandas and Plotly to give you a clear view of the most frequent target files in the malicious LNKs.

3. Visualize relationships with a Sankey diagram.

To dig deeper and understand the relationships between the infected machines and the malware, you can ask for a more advanced visualization:

Create a Sankey diagram connecting MachineID (source) to TargetFileDOSName (target), with link widths representing the number of occurrences. Include only MachineID values with 10 or more occurrences, grouping the rest as "Other", and make the visualization interactive with hover details.

Code generated:

import plotly.graph_objects as go
import pandas as pd

# Ensure df_flat is available from previous steps
# If not, you might need to re-run the cell that creates df_flat.

# Check if necessary columns exist in df_flat
if 'lnk_info.machine_id' in df_flat.columns and 'exiftool.TargetFileDOSName' in df_flat.columns:

    # Calculate the frequency of each machine ID and target file name pair
    pair_frequencies = df_flat.groupby(['lnk_info.machine_id', 'exiftool.TargetFileDOSName']).size().reset_index(name='frequency')

    # Identify MachineIDs with less than 10 occurrences
    machine_id_counts = pair_frequencies.groupby('lnk_info.machine_id')['frequency'].sum().reset_index(name='count')
    other_machine_ids = machine_id_counts[machine_id_counts['count'] < 10]['lnk_info.machine_id'].tolist()

    # Replace infrequent MachineIDs with 'Other'
    pair_frequencies['source_node'] = pair_frequencies['lnk_info.machine_id'].apply(lambda x: 'Other' if x in other_machine_ids else x)

    # Aggregate frequencies for the 'Other' node and other valid nodes
    sankey_data = pair_frequencies.groupby(['source_node', 'exiftool.TargetFileDOSName'])['frequency'].sum().reset_index()

    # Create unique labels for the Sankey nodes
    all_nodes = pd.concat([sankey_data['source_node'], sankey_data['exiftool.TargetFileDOSName']]).unique()
    label_to_index = {label: i for i, label in enumerate(all_nodes)}

    # Create the Sankey diagram
    fig = go.Figure(data=[go.Sankey(
        node=dict(
            pad=15,
            thickness=20,
            line=dict(color="black", width=0.5),
            label=all_nodes,
            color="blue"
        ),
        link=dict(
            source=sankey_data['source_node'].map(label_to_index),
            target=sankey_data['exiftool.TargetFileDOSName'].map(label_to_index),
            value=sankey_data['frequency'],
            label=sankey_data.apply(lambda row: f"{row['source_node']} -> {row['exiftool.TargetFileDOSName']}: {row['frequency']}", axis=1)
        )
    )])

    fig.update_layout(title_text="MachineID to TargetFileDOSName Sankey Diagram (Infrequent MachineIDs grouped as 'Other')", font_size=10)
    fig.show()
else:
    print("Required columns 'lnk_info.machine_id' or 'exiftool.TargetFileDOSName' not found in the DataFrame.")

This will create a powerful visualization that shows how different machines are being targeted with specific files, allowing us identify patterns for each machineID metadata.

Sankey diagram

4. Analyze the behavior of the LNK files.

Finally, you can investigate the behavior of the LNK files themselves, for example, by looking at how they are executed:

Create a pie chart depicting the distribution of window behaviors for LNK target processes (hidden, minimized,...).

Code generated:

import plotly.express as px
import pandas as pd

# Check if the relevant column exists
if 'lnk_info.header.show_window_str' in df_flat.columns and not df_flat['lnk_info.header.show_window_str'].empty:
    # Count the occurrences of each window behavior string
    window_behavior_counts = df_flat['lnk_info.header.show_window_str'].value_counts().reset_index()
    window_behavior_counts.columns = ['Window Behavior', 'Count']

    # Create an interactive pie chart
    fig = px.pie(window_behavior_counts,
                 names='Window Behavior',
                 values='Count',
                 title='Distribution of LNK Target Process Window Behaviors',
                 hover_data={'Count': True})
    fig.show()
else:
    print("The 'lnk_info.header.show_window_str' column was not found or is empty in the flattened data. Cannot create the pie chart.")
Pie chart of window behaviors

This allows you to quickly identify if the LNK files are trying to hide their execution, a common use case for malware.

5. Geographic Threat Mapping of Submissions

Understanding the geographical distribution of malware submissions can provide crucial insights into whether a campaign is widespread or targeting a specific region. By analyzing the submission metadata for our set of LNK files, an analyst can quickly identify potential hotspots, which could indicate a geographically focused attack. This is achieved by fetching the submissions relationship for each file, extracting the country of origin for each submission, and plotting this data on a world map (please note that submissions doesn’t mean targeted countries, but in some cases could be related).

Using the LNK files identified previously, create a code snippet that retrieves the submissions relationship for each file. Then, count the number of submissions from each country and display the results on a choropleth world map to visualize the submission hotspots.

In this case, Gemini uses the step-by-step execution, which basically is a set of consecutive executions. The code generated was:

Step 1
query_results_with_submissions = []

# Define the search query string for LNK files
query = "fs:2025-01-01+ fs:2025-04-01- p:5+ type:lnk"

# Define the relationship to request
RELATIONS = "submissions"

# Define the relationship attributes to retrieve (all attributes)
ATTRIBUTES_RELATIONS = "*"

# Use cli.iterator to perform an intelligence search with the specified query, relationships, and relationship attributes.
async for itemobj in cli.iterator('/intelligence/search', params={'query': query, 'relationships': RELATIONS, 'relationship_attributes[%s]'%(RELATIONS): ATTRIBUTES_RELATIONS}, limit=0):
    query_results_with_submissions.append(itemobj.to_dict())

# Convert query_results_with_submissions to a list called lnk_files_with_submissions
lnk_files_with_submissions = list(query_results_with_submissions)

# Print the number of LNK files found with submission data.
print(f"Found {len(lnk_files_with_submissions)} LNK files with submission data matching the criteria.")
Step 2
import pandas as pd

# Initialize an empty list to store submission countries
submission_countries = []

# Iterate through each item (LNK file) in the lnk_files_with_submissions list
for item in lnk_files_with_submissions:
    # Check if 'relationships' and 'submissions' exist and are not empty
    if 'relationships' in item and 'submissions' in item['relationships'] and item['relationships']['submissions']['data']:
        # Iterate through each submission object
        for submission in item['relationships']['submissions']['data']:
            # Extract the 'country' from 'submission['attributes']' and append it to the list
            if 'country' in submission['attributes']:
                submission_countries.append(submission['attributes']['country'])

# Convert the submission_countries list into a pandas Series
submission_countries_series = pd.Series(submission_countries)

# Count the occurrences of each country and store in a DataFrame
country_counts = submission_countries_series.value_counts().reset_index()
country_counts.columns = ['country', 'count']

print(f"Total unique countries found: {len(country_counts)}")
print("Top 5 submission countries:")
print(country_counts.head())
Step 3
!pip install pycountry
import plotly.express as px
import pandas as pd
import pycountry

# Function to get ISO-3 code from country name
def get_iso3(country_name):
    try:
        return pycountry.countries.search_fuzzy(country_name)[0].alpha_3
    except:
        return None

# Apply the function to get ISO-3 codes
country_counts['iso_alpha'] = country_counts['country'].apply(get_iso3)

# Create a world heatmap using Plotly Express with ISO-3 codes
fig = px.choropleth(country_counts.dropna(subset=['iso_alpha']), # Drop rows where ISO code couldn't be found
                      locations="iso_alpha", # Use ISO-3 codes for locations
                      locationmode='ISO-3',   # Specify ISO-3 location mode
                      color="count",
                      hover_name="country",
                      color_continuous_scale="Viridis",
                      title="Submission Country Heatmap")

# Update layout to increase figure size
fig.update_layout(
    autosize=False,
    width=1000, # Adjust width as needed
    height=600 # Adjust height as needed
)

fig.show()
World heatmap of submissions

More Examples

Here are some other examples of how you can use natural language to query the VirusTotal API:

  • Find malicious Chrome extensions (based on this blog):

This specific question is actually a really good example of how Google Colab will run the step-by-step process. As you can see, we asked different questions in the same prompt, for that reason Gemini will do it in different steps.

Retrieve all the samples from the /intelligence/search endpoint with the following query: fs:2025-08-01+ fs:2025-08-14- p:5+ tag:crx have:codeinsight.

Get the bundled_files and create a new dataframe with them too, but store only those having 5 or more malicious value.

Then identify the top 5 magika of those bundled files obtained

Code generated:

Step 1
query_results_with_bundled_files = []

# Define the search query string
query = "fs:2025-08-01+ fs:2025-08-14- p:5+ tag:crx have:codeinsight"

# Define the relationship to request
RELATIONS = "bundled_files"

# Define the relationship attributes to retrieve (all attributes)
ATTRIBUTES_RELATIONS = "*"

# Use cli.iterator to perform an intelligence search with the specified query, relationships, and relationship attributes.
async for itemobj in cli.iterator('/intelligence/search', params={'query': query, 'relationships': RELATIONS, 'relationship_attributes[%s]'%(RELATIONS): ATTRIBUTES_RELATIONS}, limit=0):
    query_results_with_bundled_files.append(itemobj.to_dict())

# Convert query_results_with_bundled_files to a list called crx_files_with_bundled_files
crx_files_with_bundled_files = list(query_results_with_bundled_files)

# Print the number of found CRX files with bundled file data.
print(f"Found {len(crx_files_with_bundled_files)} CRX files with bundled file data matching the criteria.")
Step 2
import pandas as pd

# List to store all bundled file attributes
all_bundled_files_data = []

# Iterate through each CRX file with bundled file data
for crx_file in crx_files_with_bundled_files:
    if 'relationships' in crx_file and 'bundled_files' in crx_file['relationships']:
        for bundled_file in crx_file['relationships']['bundled_files']['data']:
            all_bundled_files_data.append(bundled_file.get('attributes', {}))

# Create a DataFrame from the extracted bundled file attributes
df_bundled_files = pd.json_normalize(all_bundled_files_data)

# Filter for bundled files with 5 or more malicious detections
df_malicious_bundled_files = df_bundled_files[df_bundled_files['last_analysis_stats.malicious'] >= 5]

print(f"Total bundled files extracted: {len(df_bundled_files)}")
print(f"Bundled files with 5 or more malicious detections: {len(df_malicious_bundled_files)}")

df_malicious_bundled_files.head()
Step 3
import pandas as pd
import plotly.express as px

# Check if the 'magika' column exists and is not empty in the filtered DataFrame
if 'magika' in df_malicious_bundled_files.columns and not df_malicious_bundled_files['magika'].empty:
    # Count the occurrences of each magika type
    magika_counts = df_malicious_bundled_files['magika'].value_counts().reset_index()
    magika_counts.columns = ['Magika Type', 'Count']

    # Get the top 5 most frequent magika types
    top_5_magika = magika_counts.head(5)

    print("Top 5 Magika Types in malicious bundled files:")
    print(top_5_magika)

    # Visualize the top 5 magika types
    fig = px.bar(top_5_magika,
                 x='Count',
                 y='Magika Type',
                 orientation='h',
                 title='Top 5 Magika Types in Malicious Bundled Files',
                 labels={'Count': 'Number of Occurrences', 'Magika Type': 'Magika Type'}) 
    fig.update_layout(yaxis={'categoryorder':'total ascending'}) # Order bars by count
    fig.show()
else:
    print("The 'magika' column was not found or is empty in the filtered malicious bundled files DataFrame. Cannot identify top magika types.")
  • Retrieve threat actors:
Retrieve threat actors targeting the United Kingdom with an espionage motivation. Sort the results in descending order of relevance. Display the total number of threat actors and their names.
  • Investigate campaigns:
Retrieve information about threat actors and malware involved in campaigns targeting Pakistan. For each threat actor, retrieve its country of origin, motivations, and targeted industries. For each malware, retrieve its name.

What’s next

This workshop, co-authored with Aleksandar from Sentinel LABS, will be presented at future conferences to show the community how to get the most out of the VirusTotal API. We'll be updating the content of our meta colab regularly and will share more information soon about how to get the Google Colab.

In the meantime, if you have any feedback or ideas to contribute, we are open to suggestions.

Thursday, May 13, 2021

, , , , , , , , ,

Compliant, easy and actionable integration of VirusTotal in 3rd-party products - Welcome VT Augment

TL;DR: We are releasing an official, compliant and recommended method for displaying VirusTotal context in 3rd-party products and services, so that end-users can enjoy a single pane of glass experience when working with their tools of choice. Read the docs / See the demo (click on the VirusTotal icon next to each observable).


Security analysts world-wide are demanding a single pane of glass experience from their products. Corporate cybersecurity stacks are increasingly complex: too many tools and services, information scattered across numerous databases, arduous stitching together of disparate sources, etc. Incident response and threat hunting have become a time consuming quest across multiple browser tabs. The experience is poor.

If you develop some kind of security product, you will probably know that a common request coming from users is to integrate VirusTotal threat context and reputation. CrowdStrike can speak to this popular demand, just recently we worked together to build a Falcon-VirusTotal integration for their CrowdStrike store. We will be speaking about this and other integrations with our antivirus partners in future posts.

Notwithstanding, at VirusTotal we have to make sure that our data is not misused to the detriment of the ecosystem, this is why we have a strict policy regarding scanning companies and use of our services. This is also why our premium service terms prohibit displaying raw data in 3rd-party products and interfaces, especially those exposed to end-customers.

This said, over time we have seen many legit use cases for integration, mostly revolving around enrichment (adding a layer of context) of alerts/detections that get generated through some means other than VirusTotal. Indeed, when Incident Responders and SOC analysts review alerts, they want to answer questions such as:
  • Given a hash in an alert, is there any second stage payload that I should be searching for in my environment?
  • What’s the C2 infrastructure tied to a given hash? Has it shown up in my network logs?
  • Given a domain flagged by my IDS, is it a flagrant false positive based on its popularity and malicious observations recorded by VirusTotal?
  • Given an IP address that matched my threat feeds, has it been seen serving malware? If so, which hashes? Have those been seen across my fleet of machines?
  • Once my EDR reveals a compromise, is it a well known threat to the industry? i.e. is it widely detected? Is it rather a targeted attack?
To answer these and other questions many companies have implemented a bring-your-own-api-key model where their end-users plug their VirusTotal API key into their products. Sightings recorded in those products then get automatically enriched via such key. While this is theoretically OK, it has resulted in poor and weak integrations that:
  • Are extremely basic and often just display detection ratios, which is not only on the verge of compliance but is pretty useless given today’s false positive and false negative rates.
  • Fail to display the wealth of contextual information that VirusTotal records: C2s and network traffic, delivery mechanisms, relationships with other artifacts, submission and in-the-wild metadata, crowdsourced detections via {YARA, SIGMA, IDS} rules, etc.
  • Do not evolve as VirusTotal itself improves. Whenever we incorporate new data points or release new features, these rarely show up in those integrations. Moreover, for them to show up the integrator must invest engineering resources to update the logic.
  • Miss the opportunity to create a single product experience where common customers can easily pivot from the 3rd-party product into VirusTotal to conduct deeper investigations.
Not everything is lost. We are introducing VT AUGMENT, an HTML widget that greatly reduces the heavy lifting required to display VirusTotal context in 3rd-party products:
  • It can enrich the most common threat observables: files/hashes, domains, IPs and URLs.
  • You do not need to parse complex API response objects and build fancy templates, VirusTotal directly serves a report with all the context that we have for the observable.
  • The report can be styled to match your interface.
  • VirusTotal seamlessly adds new features and data points to the widget, without requiring engineering work on your side to update.
  • It allows you to display all VirusTotal details, not just a subset of them. Moreover, it is not constrained to an analysis data dump, it also displays our threat graph for the given observable and any related IoCs.

All the details displayed in the report are pivotable, meaning that your users can search for similar files, jump to other files communicating with the same domain, discover other malware signed with the same authenticode certificate, etc. with a single click.


Most importantly, VT AUGMENT technically ensures compliance with our terms. Since we are not exposing parseable API fields, there is no room for backend black magic to drive detections, perform machine learning, copy signatures or other non-compliant use cases that would go against the VirusTotal ecosystem.

You can see VT AUGMENT in action in the following demo environment that simulates a SIEM alerts dashboard, click on the VirusTotal icon next to each observable to display the VT AUGMENT widget:
https://www.virustotal.com/ui/widget/demo/dedicated?full=1

Please note that VT AUGMENT still requires you to implement a bring-your-own-api-key model where your end-users plug their API key into your product. This said, we are also open to consider integrations driven by a single integrator key, always with prior consent from VirusTotal.


You can dive into the specifics surrounding the VT AUGMENT integration in our API reference:
https://developers.virustotal.com/v3.0/reference#widget-overview

A standard VirusTotal API key will be enough to test the flow, but remember that the final setup must make use of each of your users’ API keys, unless you have explicit permission from VirusTotal. Additionally, note that we have also published a handy javascript client library to further ease the task of displaying the widget report in your own interface:
https://github.com/VirusTotal/vt-augment

If you are interested in integrating VT AUGMENT and require more API quota to develop and test the setup, need some help with the technical implementation or want to discuss partnership opportunities involving this new widget please do not hesitate to contact us.

We will be creating a specific section in our main VirusTotal website to document and showcase these integrations. Similarly, we will be showing some gratitude to the first adopters by featuring their integrations in an upcoming blog post series on this topic, stay tuned!

Wednesday, November 06, 2019

, , , , , , , , , ,

Pipelining VT Intelligence searches and sandbox report lookups via APIv3 to automatically generate indicators of compromise

TL;DR: VirusTotal APIv3 includes an endpoint to retrieve all the dynamic analysis reports for a given file. This article showcases programmatic retrieval of sandbox behaviour reports in order to produce indicators of compromise that you can use to power-up your network perimeter/endpoint defenses. We are also releasing a set of python scripts alongside this blog post to illustrate this use case.

We recently rolled out a new Windows dynamic analysis system called VirusTotal Jujubox. This new sandbox represents a major revamp of VirusTotal’s in-house behaviour analysis capabilities as well as a key addition to the multi-sandbox project, which already aggregates behaviour reports from more than 10 partners and the most popular operating systems.

Behaviour reports are often perceived as a mechanism to understand what an individual sample does when executed, a quick overview before diving into disassembly and debugging. However, when you have a massive dynamic analysis setup processing hundreds of thousands of files per day, the microscopic dissection capability is far from being the most attractive use case.

When you generate reports at scale, and more importantly, when you index them in an elasticsearch index and expose it via API, the generated data can be used for advanced hunting, especially when this data can be combined with other static, binary and in-the-wild properties.

The basic workflow would be as follows:

  1. Periodically identify new malware variants pertaining to a family that you are tracking making use of the VT Intelligence search API. Use family variant commonalities (for instance a section name, the compilation timestamp or a document’s author metadata property) to retrieve a stream of malware.
  2. Focus on recent matches since the previous execution (query: fs:2019-11-01+).
  3. For each match, retrieve the generated behaviour reports for the pertinent file. You can also focus specifically on network communications with the contacted_ips, contacted_domains and contacted_urls relationships.
  4. For each automatically extracted network observable, check popularity ranks in order to filter out noise and FPs.
  5. All the newly yielded network artefacts (CnCs) can then be fed into SIEMs or transformed into IDS rules to power up network perimeter defenses.

Let’s illustrate this with a particular example. Bankbot is an Android banking trojan, it allows the attacker to perform:

  • SMS hijacking.
  • GPS tracking.
  • New permission requests.
  • Overlay attacks to mask legit bank apps with forms to intercept credentials. Sometimes based on a remote set of HTML templates. 

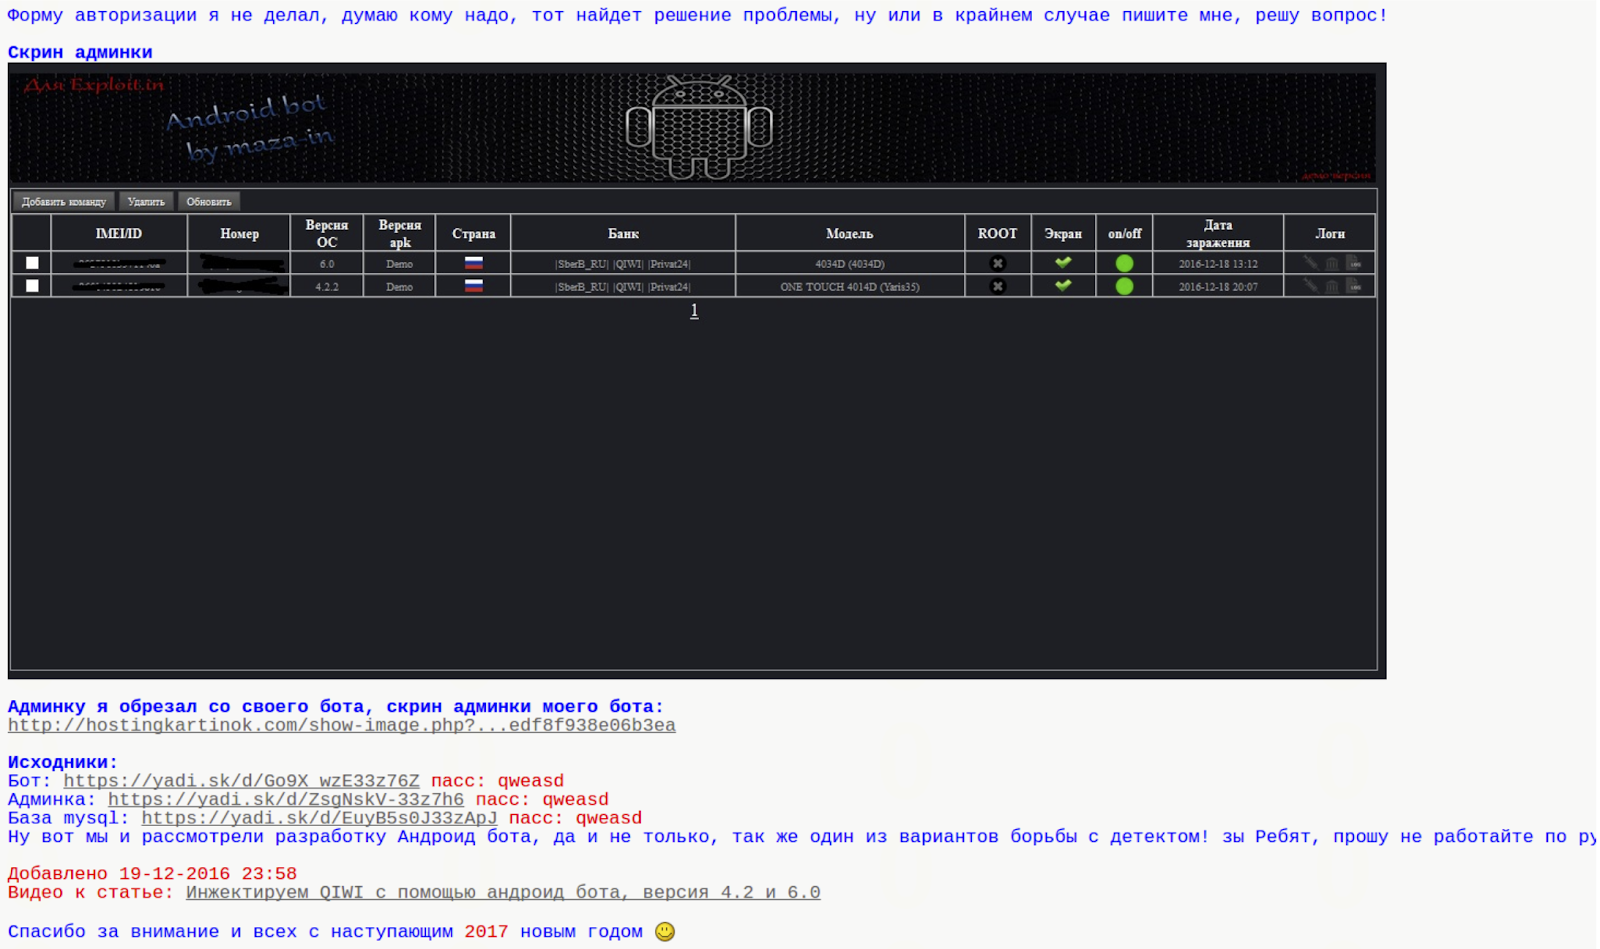
The trojan was released in an underground forum and the post included the source code for the client-side and server-side components, including the database setup to collect stolen information.


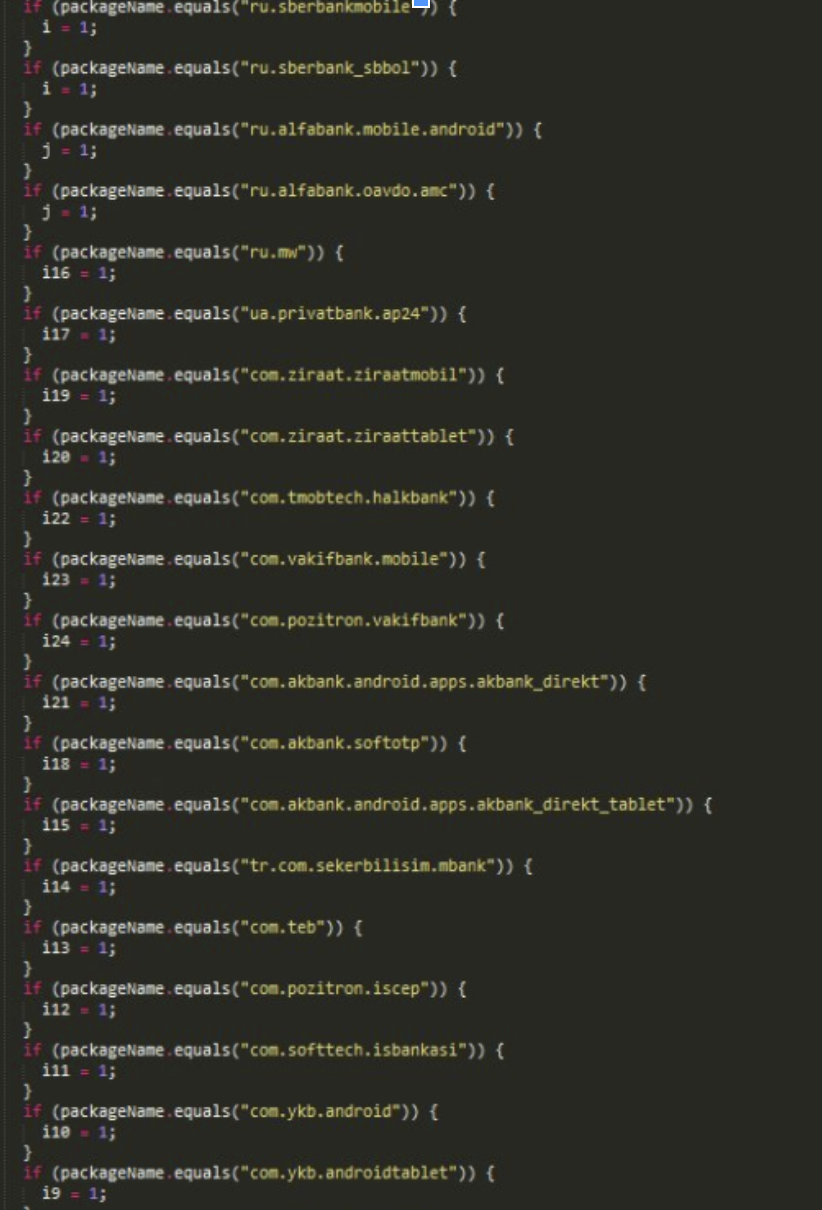
Initially, the trojan included a hardcoded list of target bank applications that it would overlay in order to intercept banking credentials:


Since the source code of the trojan was also published in the underground forum, other crooks soon modified it to accept a remote list of financial entities to attack. This makes target identification more complex, static analysis is not enough to identify the targeted banks and subsequent date-tied CnC infrastructure.


While identifying targeted financial institutions might be a more complex task, discovering new variants of the same family and automatically identifying new network infrastructure tied to it becomes easier. Why is this? A server-side remote target list leads to a common network infrastructure pattern that can be used to track the malware family.

This is an example of a Bankbot sample:
https://www.virustotal.com/gui/file/5fdbe1e83ec9c43929cc348681cb6afde12afee637feaf444a4983c317b18423/detection

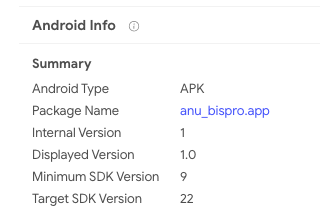
VT Enterprise allows similarity searches and other attribute searches to find additional variants of the same malware family. In this particular case, the Android package name under the details tab seems interesting, clicking on it will launch a VT Intelligence search for other Android APKs that share that very same package name:


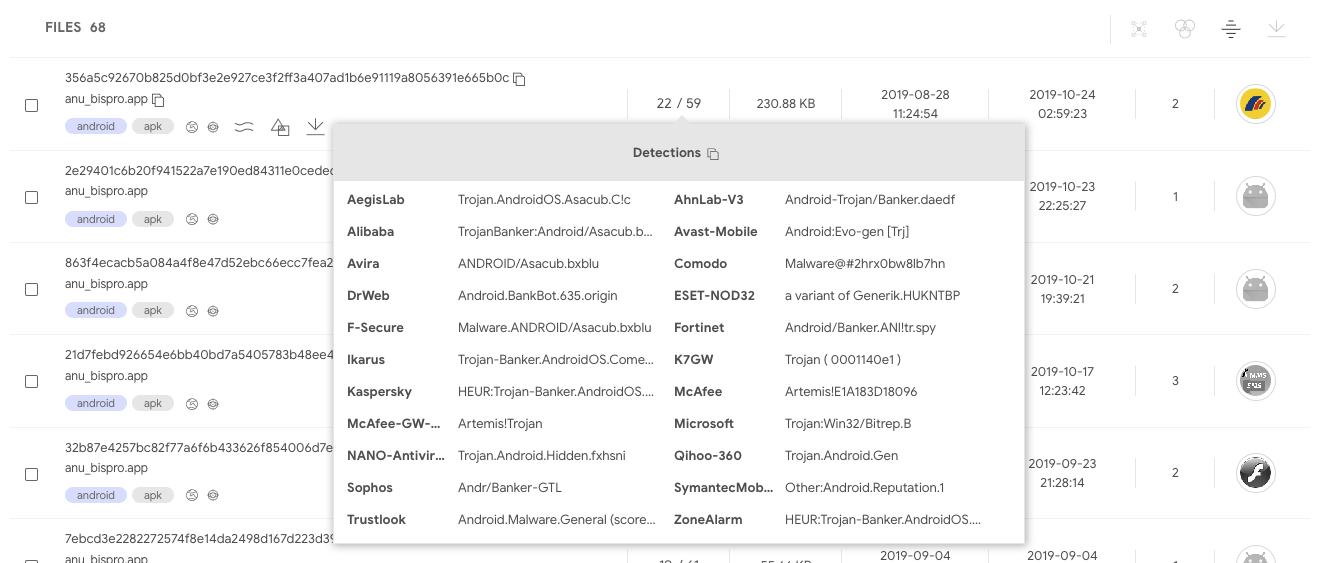
The matches do indeed seem to belong to the same family:


When opening these samples and looking at their behaviour reports, certain commonalities are easily noticed:


Static/behaviour/code commonalities are very frequent since attackers usually reuse code across different campaigns. Sometimes the commonalities are a result of recompiling the same code to communicate with a different network infrastructure. Other times, commonalities are present because the attack binaries are generated with some kind of builder or kit for dummies. Similarly, CnC infrastructure often exhibits commonalities in terms of the same path structure or query parameters, it is the result of attackers reusing the same CnC panel through a server-side kit that they deploy without changing file names or path structure.

These patterns, in conjunction with VT’s massive dynamic analysis setup and indexing, make it easy to automatically discover new malicious network infrastructure and automatically generate indicators of compromise.

The behaviour reports for the identified cluster of samples shows that the CnC panel uses the subpaths tuk_tuk.php or checkPanel.php.

Let’s use this common pattern to periodically check VirusTotal for new variants of this malware family, and by doing so, let’s identify new network infrastructure tied to this attack, live, as samples are uploaded to VirusTotal.

Using the APIv3 Intelligence search endpoint, it’s possible to search for any Android APK whose network recordings contain the substring tuk_tuk.php:
https://developers.virustotal.com/v3.0/reference#intelligence-search
type:apk behaviour_network:"tuk_tuk.php"

Multiple properties, such as dynamic/static analysis and metadata, can be combined to make a more refined search:
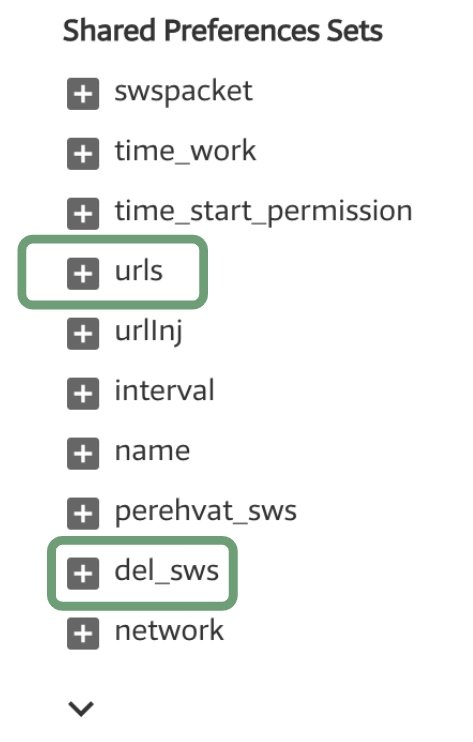
type:apk behaviour_network:"tuk_tuk.php" behaviour:"del_sws" androguard:"android.permission.ACCESS_FINE_LOCATION"

The API can sort matches according to first seen descending, meaning that by executing this search periodically and focusing on the latest results, it’s possible to discover new malicious network infrastructure tied to this particular family.

At the time of writing, this search yielded the following results:

5fdbe1e83ec9c43929cc348681cb6afde12afee637feaf444a4983c317b18423
elis[.]ru
92.53.97[.]75
hxxp://elis.ru/private/tuk_tuk.php

52998a07d22b0aa267505635898219ef6104dc6cd255bea69c7ab701285666fa
xzcxzfs.kl.com[.]ua
5.79.66[.]145
hxxp://xzcxzfs.kl.com[.]ua/private/tuk_tuk.php

7c06552f59b594ef0d650204423e97c8ab8f07588f1215ec2a469dc9cb7f5670
u36084.test93w[.]ru
hxxp://u36084.test93w[.]ru/private/tuk_tuk.php

56b220e610d17987b4f96afa79e23c3c9cab16592384ed883e9ac8240907b53b
u36206.test93w[.]ru
185.31.163[.]148
hxxp://u36206.test93w[.]ru/private/tuk_tuk.php

The Intelligence search API endpoint will return a list of file objects matching a search criteria. Each of these file objects can have one or more multi-sandbox reports. These behaviour reports can be retrieved making use of the pertinent relationship (behaviours) for each of the files:
https://developers.virustotal.com/v3.0/reference#files-relationships

It’s also possible to filter the network communication relationships fields, instead of asking for the whole report (contacted_urls, contacted_ips, contacted_domains):
https://www.virustotal.com/api/v3/intelligence/search?query=type:apk behaviour_network:”tuk_tuk.php”&relationships=contacted_urls,contacted_domains,contacted_ips

Once the pertinent network infrastructure is parsed, it’s possible to either rely on the objects returned by the network-related relationships (contacted_urls, contacted_ips, contacted_domains) or make a subsequent automated call to the domain / IP address / URL API endpoint in order to retrieve further details about the given network observable. The aim of this subsequent stage is to filter out potential false positives. For instance, among the details returned for a domain lookup, there are different popularity rank lists that can be useful to filter out TOP domains.

You can easily test this workflow with a little script released along with this blog post. This script makes use of our official APIv3 python library, it can serve as your starting point to build more complex pipelines:
https://github.com/VirusTotal/vt-py/blob/master/examples/intelligence_search_to_network_infrastructure.py

python3 intelligence_search_to_network_infrastructure.py --apikey=<YOUR_API_KEY> --query=’type:apk behaviour_network:"tuk_tuk.php"’

=== Results: ===
DOMAIN: u363571.test93w.ru
IP_ADDRESS: 185.31.163.148
URL: http://u363571.test93w.ru/private/tuk_tuk.php
DOMAIN: bot.mymaster-rem.ru
URL: http://bot.mymaster-rem.ru/private/tuk_tuk.php
DOMAIN: lensfor.xyz
URL: https://lensfor.xyz/private/tuk_tuk.php
IP_ADDRESS: 38.21.243.204
URL: http://38.21.243.204/anib/private/tuk_tuk.php
DOMAIN: f0316480.xsph.ru
IP_ADDRESS: 141.8.192.151
URL: http://f0316480.xsph.ru/private/tuk_tuk.php
DOMAIN: u36255.test93w.ru
DOMAIN: mtalk4.google.com
IP_ADDRESS: 185.31.163.148
URL: http://u36255.test93w.ru/private/tuk_tuk.php
DOMAIN: u36206.test93w.ru
IP_ADDRESS: 185.31.163.148
URL: http://u36206.test93w.ru/private/tuk_tuk.php
DOMAIN: yumishop.co.uk
URL: http://yumishop.co.uk/private/inj_lst.php
URL: http://yumishop.co.uk/private/tuk_tuk.php
DOMAIN: u36317.test93w.ru
IP_ADDRESS: 185.31.163.148
URL: http://u36317.test93w.ru/private/tuk_tuk.php
DOMAIN: u36317.test93w.ru
IP_ADDRESS: 185.31.163.148
URL: http://u36317.test93w.ru/private/tuk_tuk.php


Note that this workflow is exclusively based on behavioural observations and works independently of the detection ratio of files, by pipelining VT Intelligence searches and sandbox report lookups, it is possible to generate indicators of compromise even if the related sample is undetected. The identified domains can be automatically checked against SIEM logs or can be automatically transformed into IDS rules, serving as an additional layer in your onion-like security strategy.

This blog post focuses on combining VT Intelligence searches with behaviour lookups, the same can be done with YARA rule matches. VT Hunting Livehunt matches can programmatically retrieved using APIv3, for each match the pertinent behaviour reports can be retrieved and CnC network infrastructure can be automatically extracted. Similarly, other properties that can be used as IoCs, such as mutexes, registry keys, embedded domains, file names, cmd parameters and the like can be automatically yielded. The following two script showcase this other VT Hunting workflow:
https://github.com/VirusTotal/vt-py/blob/master/examples/hunting_notifications_to_network_infrastructure.py
https://github.com/VirusTotal/vt-py/blob/master/examples/retrohunt_to_network_infrastructure.py

If you are rather a golang fan, feel free to check out our official VirusTotal golang library:
https://github.com/VirusTotal/vt-go

APIv3 was a major component of our 2019 roadmap, soon we will be officially releasing it and announcing a generous deprecation timeline for APIv2, stay tuned!

Wednesday, June 11, 2014

, , , , ,

VirusTotal API implementation in C programming language

Many users interact programmatically with VirusTotal via its public API, it is an easy HTTP+JSON interface that allows you to easily submit and check files in order to help improve security world-wide. Moreover, many VirusTotal Community volunteers have very kindly implemented the API in a wide variety of programming languages, some of these implementations are documented here, many others exist and we will progressively adding all those that we are made aware of.

This said, there was not any full implementation of the API in the C language, so that any C or C++ program that users might be building could easily interact with VirusTotal, at least we were not aware of any. We have released a VirusTotal interface written in C to our API  on github at https://github.com/VirusTotal/c-vtapi, any C or C++ program should be able to use it. Its goal is to implement all of the public API and private API features in C. The public API features will work for anyone with a free public API key, the private API features will only work for those who have licensed our services and use a private API key.

The recently announced VirusTotal Uploader for OS X internally uses the c-vtapi project. Using C it is a common building block that other programs or languages can interface to.

Suggestions, comments, patches and github pull request for improvements are welcome. Some ideas of improvements:
  • Better windows support and testing. We have tested a lot with OS X and linux, the windows scaffolding is there, but is not well tested.
  • More example programs or command line utilities that use this C API interface. For example, we know Sebastian Poeplau, being a busy guy, was looking for collaborators that would implement VirusTotal submissions in his awesome Ghost USB project, perhaps this C implementation makes it easier to perform the integration and some volunteers stand up.

Thursday, December 13, 2012

, , , ,

Public API request rate limits and tool development

Our goal is simple: to help keep you safe on the web. For this to happen, among many other technical fireworks, we need to receive as many (hopefully malicious) files as possible that we can eventually share with the antivirus and security industry in order to allow them to improve their products and technologies.

One of the ways we envisioned increased submissions to VirusTotal was through the release of our public API. Many tools and security deployments (honeypots, honeyclients, sandboxes, etc.) are making use of it and we are delighted that they do so. However, very often I see that integration with VirusTotal's API could be simpler.

Many users ignore the fact that public API request rate limits are enforced on (IP address, API key) tuples. What does this mean? Users sharing a same API key with different IP addresses will be subjected to independent request rate counters. Putting it simpler, if you are a tool developer, you might want to create a public API key for your tool and embed it in your application, that way, by default, you would not have to ask the user to create an API key and the whole integration with VirusTotal would be transparent. 

Having said this, it is always wise to have a settings file or tab that allows users to change this default key:
  • Some users might be behind some sort of proxy, corporate network aggregator, NATting device, or similar setup that makes them share the same IP address with other users of your tool, these users should be given the option to create their own API key and modify the setting in your tool.
  • Some users might just want to use an independent key in order to track their own submissions in their VirusTotal Community profile.
  • Some users might simply find the public API request rate limit too low, they might want to speak with VirusTotal about the possibility of getting a private API key, they should be able to embed that independent private API key in your setup.

So, imagine this hypothetical situation: I want to build a tool that whenever a USB storage device is plugged into a given PC it inspects its files, looks for any autorun.inf file and submits to VirusTotal any referenced executables in it. I would create an VirusTotal Community account for my tool and retrieve the corresponding API key, I would hardcode that into my application and make the tool use it by default. This said, I would also have a settings tab in my application that would allow users to change this key for any other key they might register. Of course, I would plan to render the corresponding messages informing a user about the fact they can modify the default key whenever request rate limitations are met because of IP sharing.

Hope this is useful and I would love to see more VirusTotal plugins out there with a more transparent integration such as the one described above. As usual, before doing any kind of integration please look at our Terms of Service and Best practices, tools competing with the antivirus industry or jeopardizing such industry will be immediately banned from the service. VirusTotal is a tool to help antivirus vendors in improving their products, not a means to discredit, harm them in any way or steal their intellectual property, we take this matter very seriously.