

Not all the investigations are tackled the same way. Sometimes from a single sample we need to quickly find as much context as possible. In other situations, we are presented with a handful of IOCs and we need to make a sense of what’s going on.
Context in less than 1 minute
First, we create a new graph using the IOCs from the previous link, in this case:
- 49de707fc2d7e44e14f8d50ea7d731fd8abda3418acd106c78cee833183e240f
- aa435c4da9fa1bb3bb186a0bce1fd9710c227b8d72fa82d71a426df82c236eb1
- 7bc0f932d40f17abc43f8b25a9d75408b192f55c742a02843c5e31869d3d4684
At this point, the new graph will automatically calculate all the relationships for us. This can be a bit noisy if we are only interested in the infrastructure, so we can remove all the other relationships leaving only “contacted URLs” and “contacted IPs”. This results in the following graph:

What else to do here? For instance, you can fully expand the node with the suspicious IP 185.215.113[.]31 to find all the samples downloaded from it (quite a lot) in order to continue your investigation. If we would be interested in keeping the full relationships automatically created in this graph instead of a simplified version for the infrastructure, we could also find similar files to the ones we are analyzing. Another interesting finding is a common file between the analyzed samples found in the PCAP files resulting from their execution in sandboxes: this file contains the malicious injects sent from the C&C server to the bots.
This is a lot of information from just dropping some IOCs into a graph! Most of the time this will be more than enough for having a first idea of what we are dealing with.
Map the entire infrastructure behind a domain
Sometimes a simple domain investigation can turn into a complex scenario. Given the nature of the dataset in which VirusTotal Graph works, it is easy to find all the subdomains, URLs and resolutions that VirusTotal knows about a domain.
Let’s take a look at the suspicious “ladycash[.]ru” domain. We can simply do a series of relationships expansions to reach a point where we uncover different sub-domains and all the different IP addresses all over the world they resolve. And voilà! After a few clicks we have valuable data to continue our investigation of a potentially malicious infrastructure.

The power of the community
Probably the most amazing thing about VirusTotal Graph is our community ❤️
It is daily used by many security researchers who are happy to share their work and help with their findings making a safer world. Their public graphs are available in the VirusTotal Graph search. Below you can find some graphs that showcase some of their amazing research.
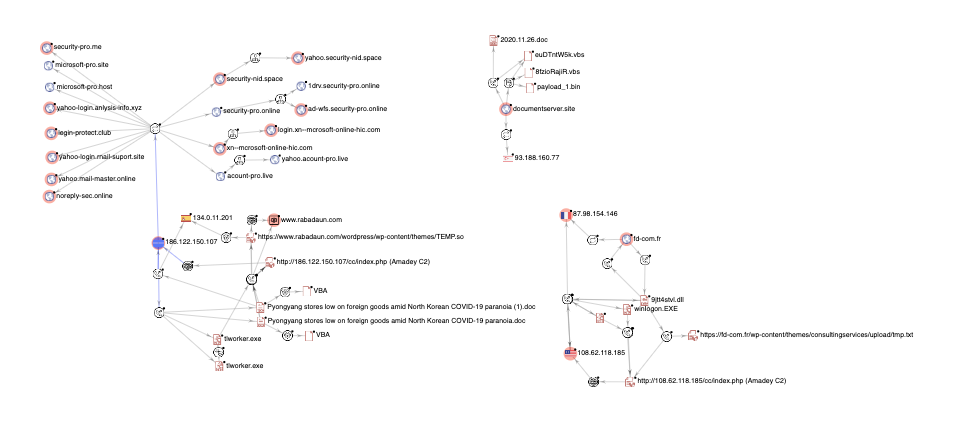
- North Korean APT leveraging Amadey Trojan by BushidoToken (Link to graph)
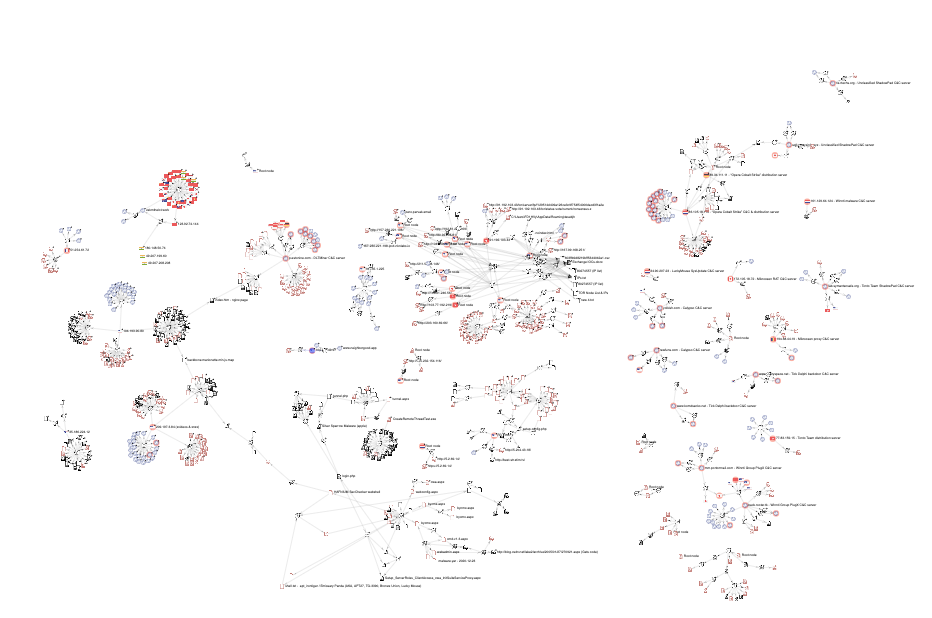
- HAFNIUM by DMS2302 (Link to graph)
Improving our toolset
Many times we find how attackers are improving their toolsets. Well, we as security practitioners should do the same! VirusTotal Graph is another tool in our pocket that can be very useful to do a quick assessment of malicious activity. Having a visual representation of all the relationships from a collection of IOCs helps to have a quick understanding of some basic properties of the set, like how the malware is clustered, what types of files we have, how many similar files are found, what is the infrastructure being used and (if we get lucky) how it is being distributed.
We are working hard to get an even improved and even more efficient version of VirusTotal Graph, so we will as always appreciate all your input and feedback on how we can help you with your visual investigations.
Happy hunting!