

To continue in this direction, today, we are releasing a set changes to help your investigations with VirusTotal Graph.
1. We have created a dashboard where you can see your graphs and the graphs created by the community.
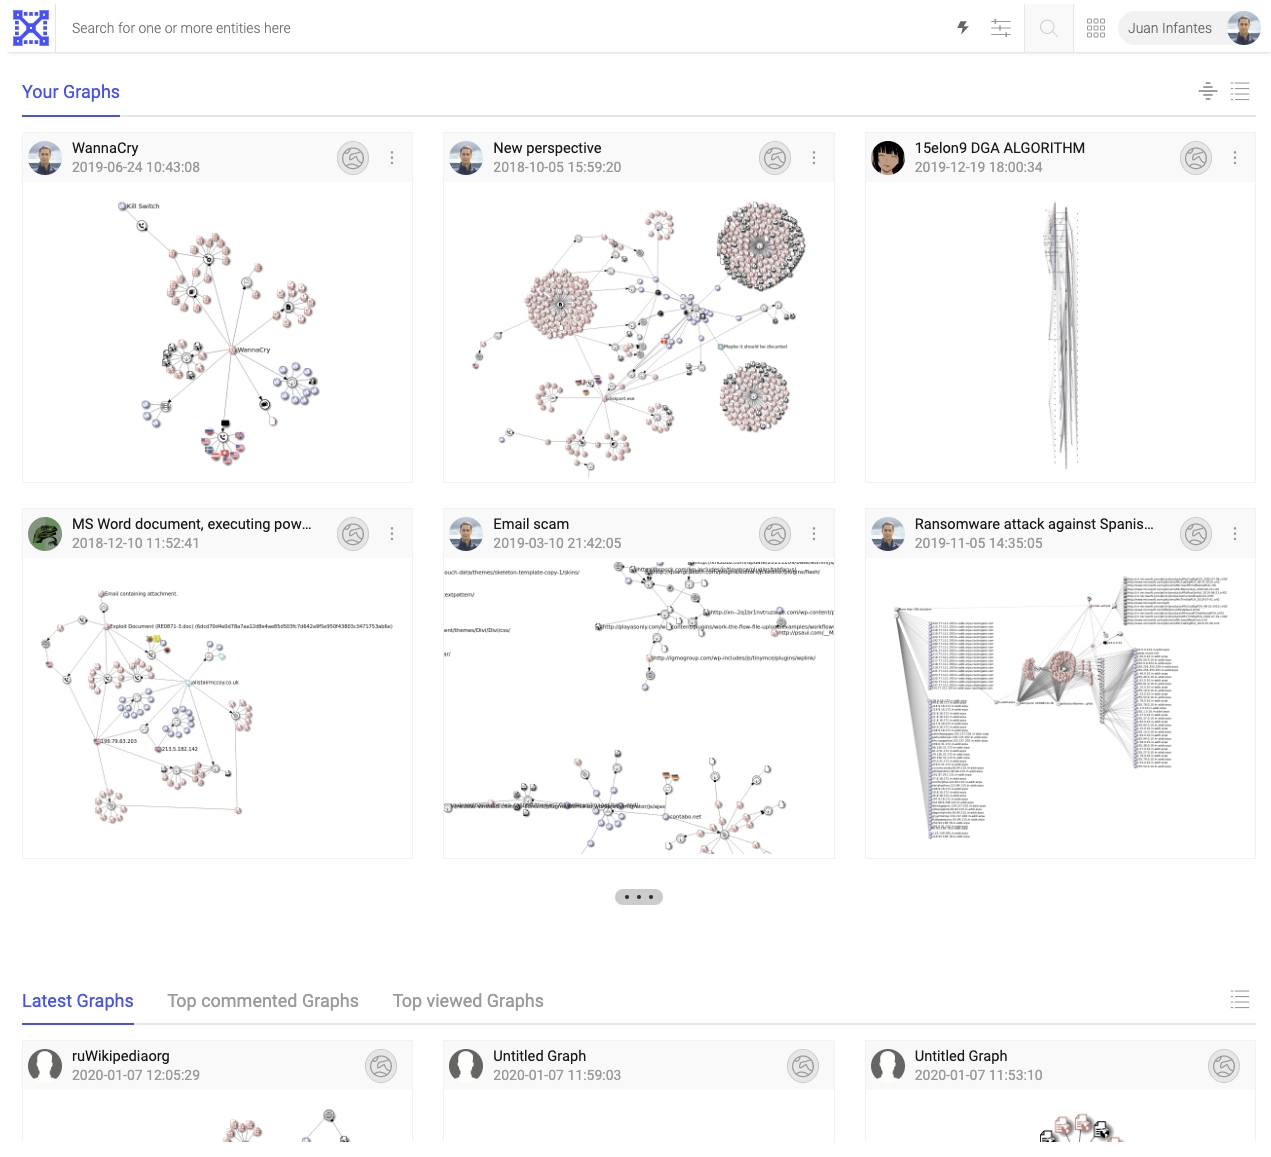
You can also search for graphs with certain features, for example, graphs that contains a node with a label “c2”. The searches will go simultaneously to the public graph repository and to your private repository.
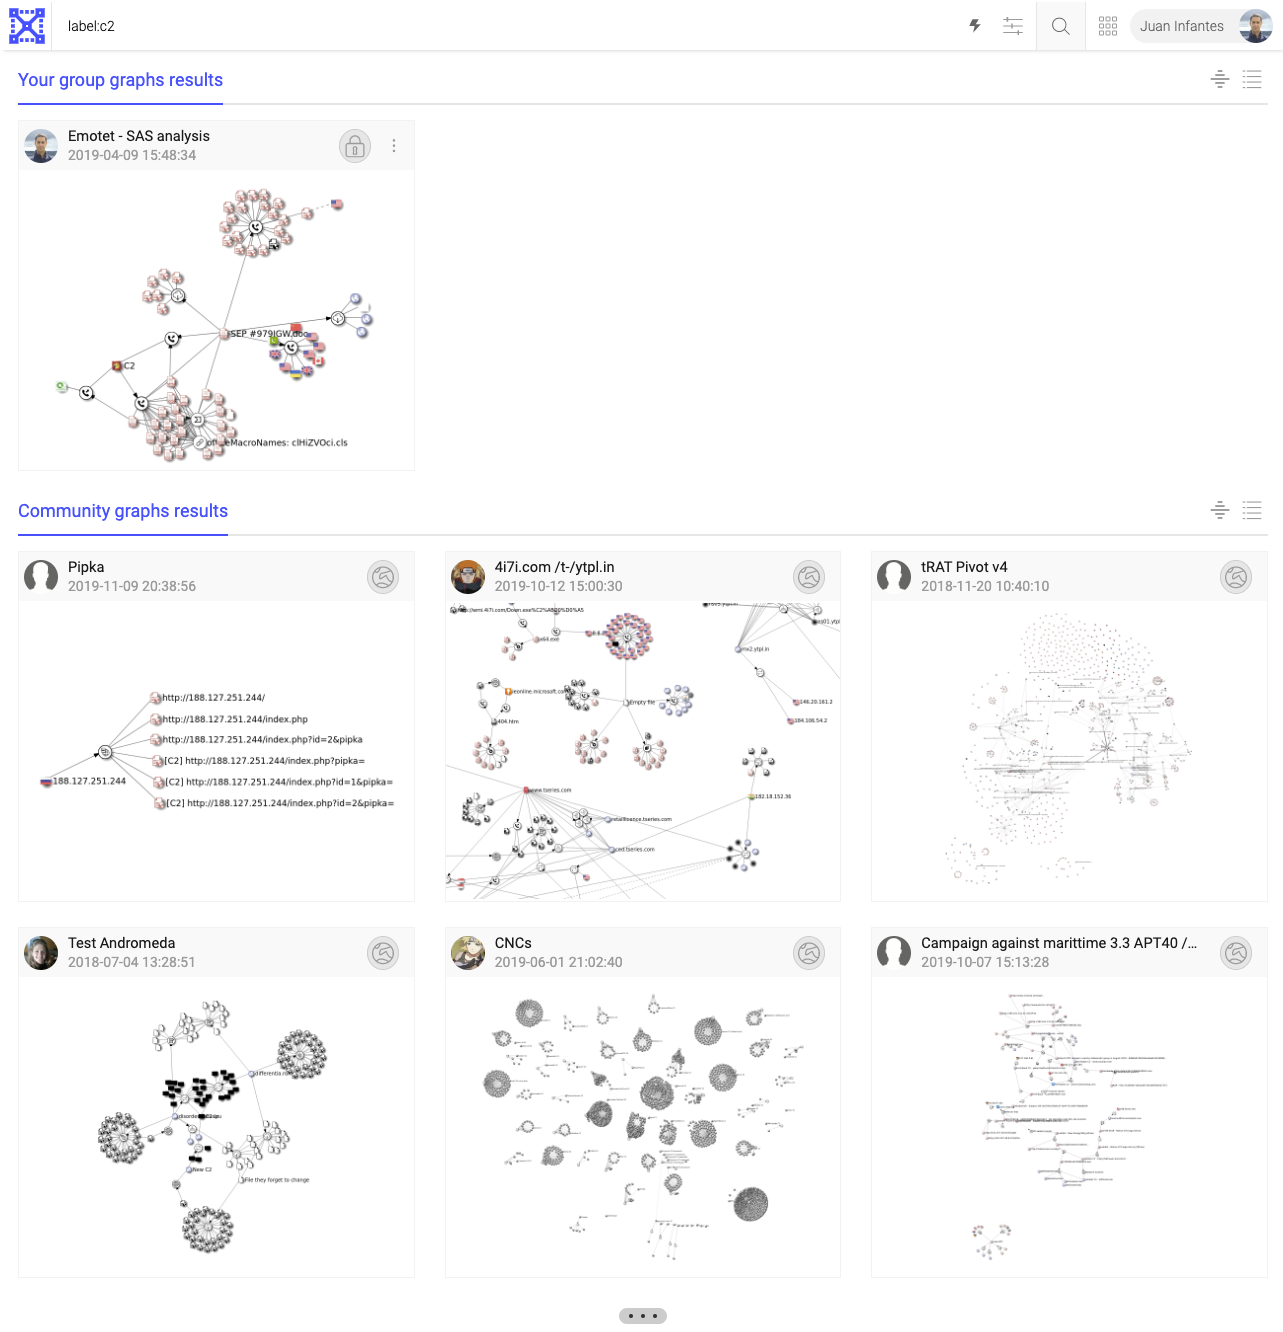
You can see the full list of search modifiers here.
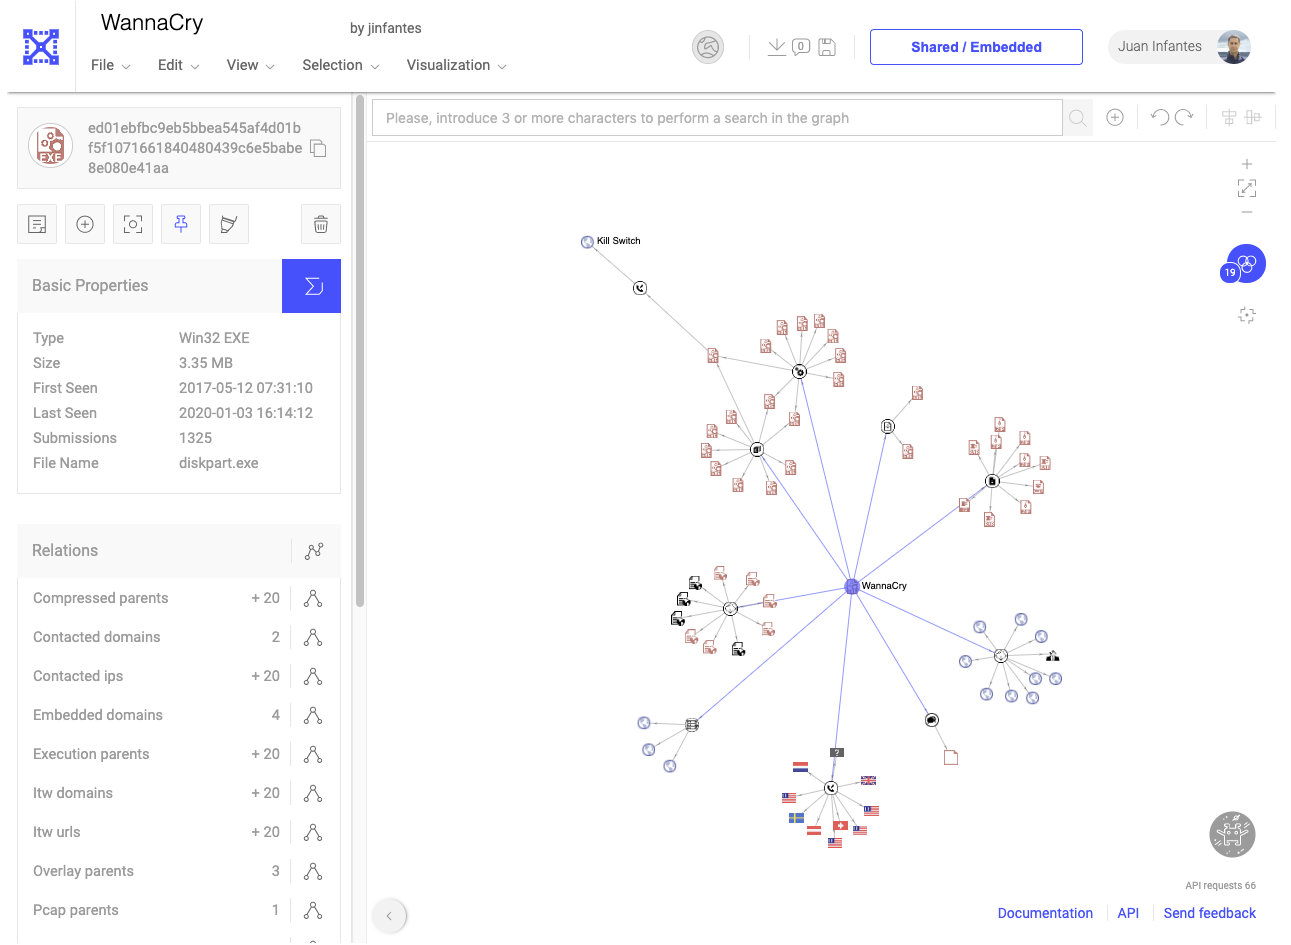
2. We’ve improved the VirusTotal Graph UI with these features, most of them coming from our power users:
- Undo/redo
- In graph search
- Download the graph as JSON and as image
- Align nodes horizontally and vertically
- New ways of visualizing the graph
- Removed the API usage. If you are a premium customer you can use VT Graph extensively, its consumption won’t count against your API quota
- Added more commonality calculations
- Integration with VT Hunting - link
3. As most of our other products, VirusTotal Graph is getting a restful API. The documentation can be found here and a Python library to reduce the learning curve; it is available in our Github repository.
In the meanwhile we are cooking very exciting enhancements that we really hope will please the Community, stay tuned. As always, we would love to hear from you.
0 comments:
Post a Comment