

TL;DR; We are publishing a new version of VirusTotal Graph that, among other things, supports VirusTotal Collections and provides a new filter engine to speed up your investigations.
Today we are proud to announce a new release of VirusTotal Graph, the tool to visually navigate the VirusTotal dataset and to create collaborative visual investigations. We heard all the feedback from the community to make VT Graphs even better.
Support for VT Collections
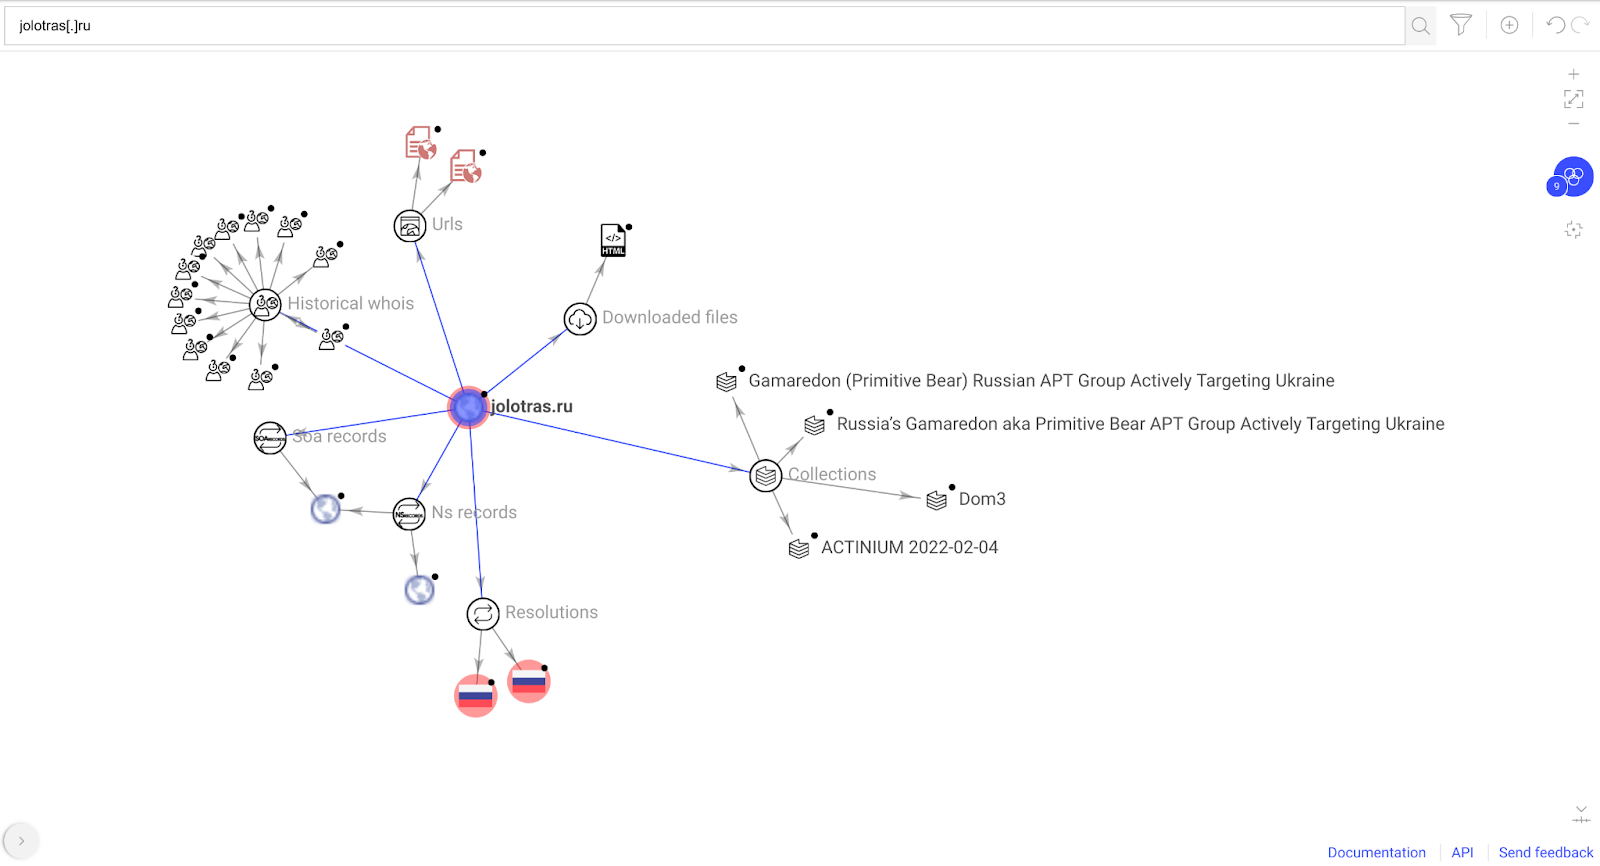

Moreover, when selecting the node it shows the main collection attributes and the possibility to pivot to their contained IOCs. This greatly helps adding both context and more elements to our current investigation without leaving the graph. The same behavior applies for referenced entities.
Additionally, we added the option to export your graph into a new collection in VirusTotal via the File menu. The collection will contain the files, URLs, domains and IP addresses present in your current graph.

Filter engine
One of the most requested features we received from the community’s feedback (send yours here) is the ability to filter out elements in VirusTotal graphs.
It is common to find yourself investigating large noisy graphs after multiple pivots and expansions. The VirusTotal dataset is very large and we want to help you find the needle in the haystack.
With that goal in mind, we are happy to introduce you to the new filters engine. You will find the filters icon at the right of the Search Bar.

For timestamps, you can find a timeline divided in buckets showing how many nodes are included in each of them. Use them to adjust your time window and filter nodes in the graph accordingly .


Each filter provides three options:
OR: When one or multiple OR conditions are selected, a node must match at least one of them to be visible.
AND: When one or multiple AND conditions are selected, a node must match all of them to be visible.
NOT: When one or multiple NOT conditions are selected, a node must not match any of them to be visible.
After a filter is applied the graph is updated automatically. Similarly, when the user clicks on “Removed filtered nodes” nodes not visible from the graph are removed and filters reset. You can start over again and re-play the filtering flow from there.

You can apply filters to all the nodes in the graph, a selection or nodes in a given relationship. To apply filters on specific nodes just select them. If the filter drawer is already open, it will be automatically refreshed.
Back to our initial investigation, we could filter IP addresses resolutions seen during the 2022 with at least one detection.

You can find full Filters engine documentation here.
We are really excited with this new version of VT Graph. We find it easier to use, and the new functionalities really help to make investigations much more agile and clean. VT Collections add nice extra context, and exporting investigations into Collections makes results more actionable and collaborative. We welcome everyone to give it a try and to keep sharing your feedback with us.
Happy hunting!
0 comments:
Post a Comment