

Recently we called out Additional crispinness on the MacOS box of apples sandbox, continuing with our effort to improve our malware behavior analysis infrastructure we are happy to announce the deployment of a new Android sandbox that replaces the existing system that was developed back in 2013.
This setup characterises the actions that Android APKs perform when installed and opened; it has been baptised as “VirusTotal Droidy”. Droidy has been integrated in the context of the multisandbox project and extracts juicy details such as:
- Network communications and SMS-related activity.
- Java reflection calls.
- Filesystem interactions.
- SQLite database usage.
- Services started, stopped, etc.
- Permissions checked.
- Registered receivers.
- Crypto-related activity.
- Etc.
You may find below a couple of reports showcasing this new functionality. Just select the “VirusTotal Droidy” entry in the multisandbox report selector (whenever there are multiple reports):
Don’t forget to also check the detailed report:
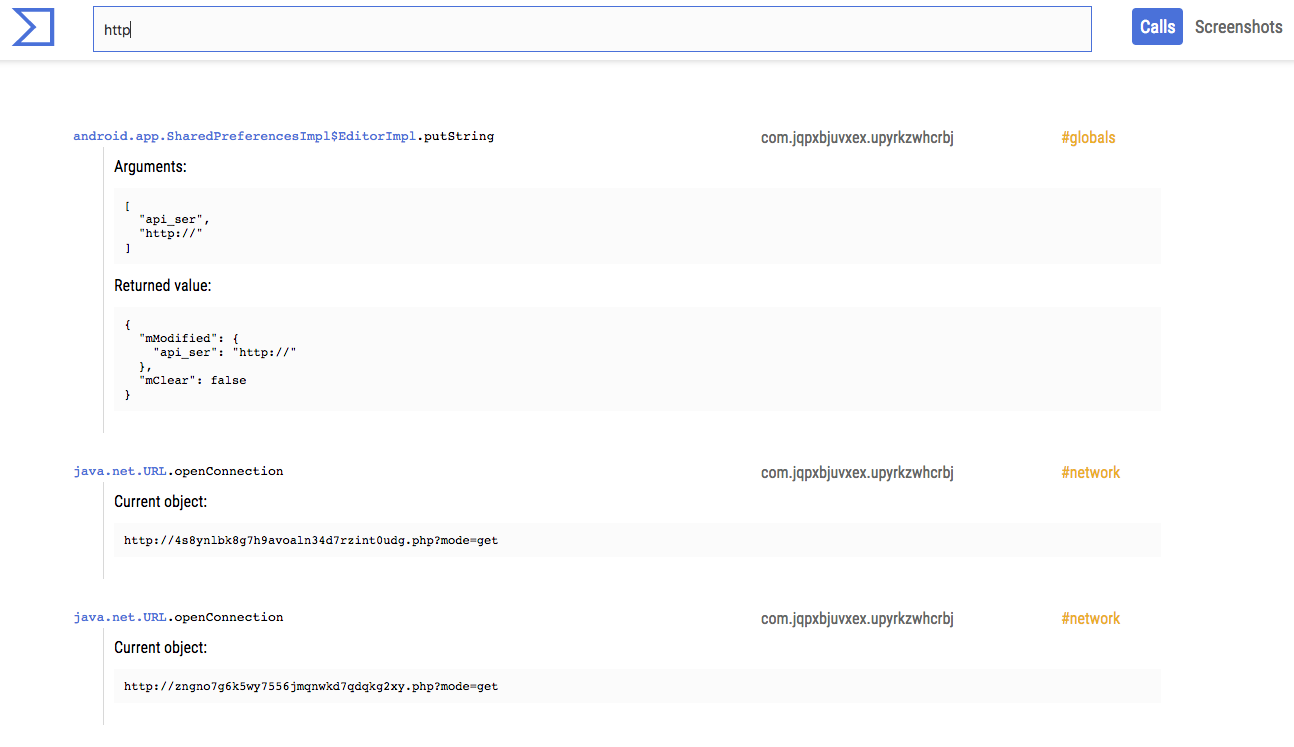
This advanced view allows you to dig into the hooked calls and take a look at the screenshots generated when running the apps:
The multisandbox project is in good shape, and now many samples have reports for multiple sandboxes. For instance, the following report allows you to see the output of Tencent HABO and VirusTotal Droidy:
As you can see, they are pretty complementary, proving the value of having different sandboxing technologies studying the same files.
To understand the extent to which this is an improvement with respect to the 2013 setup, you can take a look at the following report. It displays by default the output of the old sandbox. Use the selector to see the new report with VirusTotal Droidy:
Now, these may seem like minimal features to improve VirusTotal’s “microscope” capabilities for better understanding a particular threat. In fact, the changes go much deeper. All of our sandboxing information nurtures other services such as VirusTotal Intelligence and VirusTotal Graph. The richer the information that we generate for individual data set items, the greater the telescopic capabilities of VirusTotal. This is how we manage to fill in the dots and quickly see all activity tied to certain resources that often show up in malware investigations. For example, let us look at the graph of one of the domains seen in the previous reports:

At a glance you can understand that something shady is going on with wonderf00l.gq and you are able to discover other malicious domains such as flashinglight.tk, checkingupd.tk, flashupdservice.cf, etc. Some of these, for instance checkolimpupd.tk, are not only used as C2 infrastructure for malware but also serve as malware distribution points.
Very often during an investigation, you might not have enough context about an individual threat, and so being able to look at the connected URLs, domains, files, IP addresses, etc. becomes crucial in understanding what is going on. My colleague Evan explains this far better than I can do in just a couple of paragraphs, so make sure you check out his video dissecting a cryptomining attack at https://www.virustotal.com/learn/watch/.
Wrapping up, don’t think of this as just new functionality to dissect individual threats. All of this data contributes to the bigger picture and increases the power of our telescope lens that sheds light into malicious behaviors on the Internet.
0 comments:
Post a Comment